NVIDIA 2007 Annual Report Download - page 49
Download and view the complete annual report
Please find page 49 of the 2007 NVIDIA annual report below. You can navigate through the pages in the report by either clicking on the pages listed below, or by using the keyword search tool below to find specific information within the annual report.-
 1
1 -
2
-
3
-
4
-
5
-
6
-
7
-
8
-
9
-
10
-
11
-
12
-
13
-
14
-
15
-
16
-
17
-
18
-
19
-
20
-
21
-
22
-
23
-
24
-
25
-
26
-
27
-
28
-
29
-
30
-
31
-
32
-
33
-
34
-
35
-
36
-
37
-
38
-
 39
39 -
 40
40 -
 41
41 -
 42
42 -
 43
43 -
 44
44 -
 45
45 -
 46
46 -
 47
47 -
 48
48 -
 49
49 -
 50
50 -
 51
51 -
 52
52 -
 53
53 -
 54
54 -
 55
55 -
 56
56 -
 57
57 -
 58
58 -
 59
59 -
60
-
61
-
62
-
63
-
64
-
65
-
66
-
67
-
68
-
69
-
70
-
71
-
72
-
73
-
74
-
75
-
76
-
77
-
78
-
79
-
80
-
81
-
82
-
83
-
84
-
85
-
86
-
87
-
88
-
89
-
90
-
91
-
92
-
93
-
94
-
95
-
96
-
97
-
98
-
99
-
100
-
101
-
102
-
103
-
104
-
105
-
106
-
107
-
108
-
109
-
110
-
111
-
112
-
113
-
114
 |
 |

MCP Business. MCP Business revenue was $352.3 million for fiscal 2006, compared to $175.7 million for fiscal 2005, which
represents an increase of 100.6%. The overall increase in MCP Business revenue is primarily due to increased sales of NVIDIA
nForce4 products, which we began selling during the fourth quarter of fiscal 2005, and an increase in average selling prices. The
overall increase was offset by a decrease in sales of NVIDIA nForce3 and NVIDIA nForce2 products.
Handheld GPU Business. Handheld GPU Business revenue was $58.7 million for fiscal 2006, compared to $45.9 million for
fiscal 2005, which represents an increase of 27.9%. The overall increase in Handheld GPU Business revenue is due to an increase in
average selling prices of high−end feature phone products and revenue recognized as a result of a development contract.
Consumer Electronics Business. Consumer Electronics Business revenue was $167.4 million for fiscal 2006, compared to
$260.0 million for fiscal 2005, which represents a decrease of 35.6%. The decrease in our Consumer Electronics Business is a result of
decreased and discontinued sales of our Xbox−related products to Microsoft, partially offset by revenue recognized from our
contractual arrangement with SCE. During the first quarter of fiscal 2006, Microsoft indicated that it would not order any more
Xbox−related products from us after our second fiscal quarter. As a result, we recognized revenue from the sale of our Xbox−related
products to Microsoft for the last time during the second quarter of fiscal 2006. During fiscal 2006, we recognized $49.0 million of
revenue from our contractual arrangements with SCE to jointly develop a custom GPU for SCE's PlayStation3. No such revenue was
recognized during our fiscal 2005 as our definitive agreement with SCE was not executed until the first quarter of fiscal 2006.
Concentration of Revenue
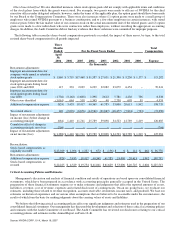
Revenue from sales to customers outside of the United States and other Americas accounted for 83.6%, 84.0% and 75.9% of
total revenue for fiscal 2007, 2006, and 2005, respectively. Revenue by geographic region is allocated to individual countries based on
the location to which the products are initially billed even if the foreign contract equipment manufacturers, or CEMs', add−in board
and motherboard manufacturers' revenue is attributable to end customers in a different location. The increase in the percentage of
revenue from sales to customers outside of the United States and other Americas for fiscal 2006 as compared to fiscal 2005 was
primarily due to discontinued sales of XGPUs and MCPs used in the Microsoft Xbox product during fiscal 2006, which were billed to
Microsoft in the United States.
Sales to our significant customers accounted for approximately 12% of our total revenue from one customer during fiscal year 2007,
26% of our total revenue from two customers during fiscal year 2006, and 31% of our total revenue from two customers during fiscal
year 2005.
Gross Profit
Gross profit consists of total revenue, net of allowances, less cost of revenue. Cost of revenue consists primarily of the cost of
semiconductors purchased from subcontractors, including wafer fabrication, assembly, testing and packaging, manufacturing support
costs, including labor and overhead associated with such purchases, final test yield fallout, inventory provisions and shipping
costs. Cost of revenue also includes development costs for license and service arrangements. Gross margin is the percentage of gross
profit to revenue. Our gross margin can vary in any period depending on the mix of types of products sold. Our gross margin was
42.4%, 38.3%, and 32.2% for fiscal years 2007, 2006 and 2005, respectively. A discussion of our gross margin results for each of our
operating segments is as follows:
Fiscal Year 2007 vs. Fiscal Year 2006
GPU Business. The gross margin of our GPU Business increased during fiscal 2007 as compared to fiscal 2006, primarily due
to the sale of our GeForce 8 series GPUs and increased sales of our GeForce 7 series GPUs, which collectively accounted for
approximately 70% of our GPU Business revenue. Our GeForce 8 and our GeForce 7 series GPUs generally have higher gross
margins than our previous generations of GPUs.
MCP Business. The gross margin of our MCP Business decreased during fiscal 2007 as compared to fiscal 2006, primarily due
to a shift in product mix to higher volumes of integrated AMD−based desktop products which have experienced lower gross margins
than our discrete MCP products, and inventory reserves that we recorded as a charge to cost of revenue that primarily related to
purchase commitments that we believed had exceeded future demand.
41
Source: NVIDIA CORP, 10−K, March 16, 2007