Logitech 2008 Annual Report Download - page 75
Download and view the complete annual report
Please find page 75 of the 2008 Logitech annual report below. You can navigate through the pages in the report by either clicking on the pages listed below, or by using the keyword search tool below to find specific information within the annual report.-
 1
1 -
2
-
3
-
4
-
5
-
6
-
7
-
8
-
9
-
10
-
11
-
12
-
13
-
14
-
15
-
16
-
17
-
18
-
19
-
20
-
21
-
22
-
23
-
24
-
25
-
26
-
27
-
28
-
29
-
30
-
31
-
32
-
33
-
34
-
35
-
36
-
37
-
38
-
39
-
40
-
41
-
42
-
43
-
44
-
45
-
46
-
47
-
48
-
49
-
50
-
51
-
52
-
53
-
54
-
55
-
56
-
57
-
58
-
59
-
60
-
61
-
62
-
63
-
64
-
 65
65 -
 66
66 -
 67
67 -
 68
68 -
 69
69 -
 70
70 -
 71
71 -
 72
72 -
 73
73 -
 74
74 -
 75
75 -
 76
76 -
 77
77 -
 78
78 -
 79
79 -
 80
80 -
 81
81 -
 82
82 -
 83
83 -
 84
84 -
 85
85 -
86
-
87
-
88
-
89
-
90
-
91
-
92
-
93
-
94
-
95
-
96
-
97
-
98
-
99
-
100
-
101
-
102
-
103
-
104
-
105
-
106
-
107
-
108
-
109
-
110
-
111
-
112
-
113
-
114
-
115
-
116
-
117
-
118
-
119
-
120
-
121
-
122
-
123
-
124
 |
 |

F-5
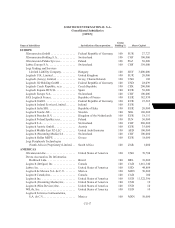
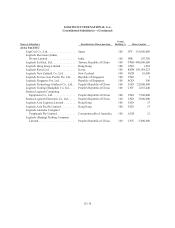
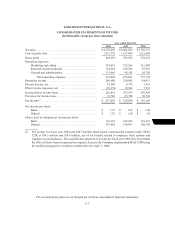
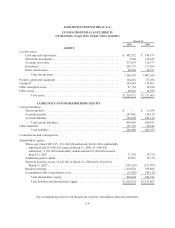
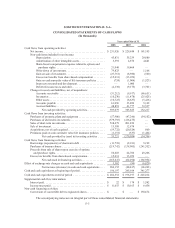
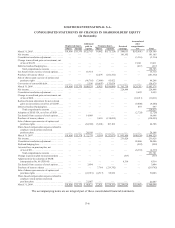
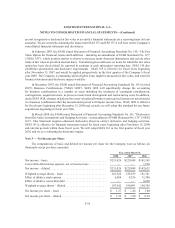
LOGITECH INTERNATIONAL S.A.
CONSOLIDATED STATEMENTS OF CASH FLOWS
(In thousands)
Year ended March 31,
2008 2007 2006
Cash flows from operating activities:
Net income. . . . . . . . . . . . . . . . . . . . . . . . . . . . . . . . . . . . . . . . . . . . . $ 231,026 $ 229,848 $ 181,105
Non-cash items included in net income:
Depreciation . . . . . . . . . . . . . . . . . . . . . . . . . . . . . . . . . . . . . . . 43,831 35,239 29,880
Amortization of other intangible assets. . . . . . . . . . . . . . . . . . . 5,391 4,876 4,641
Share-based compensation expense related to options and
purchase rights. . . . . . . . . . . . . . . . . . . . . . . . . . . . . . . . . . . . 21,040 19,464 —
Write-down of investments . . . . . . . . . . . . . . . . . . . . . . . . . . . . 79,823 — 1,168
Gain on sale of investment . . . . . . . . . . . . . . . . . . . . . . . . . . . . (27,761) (8,980) (560)
Excess tax benefits from share-based compensation . . . . . . . . (15,231) (13,076) —
Gain on cash surrender value of life insurance policies . . . . . . (724) (1,006) (1,523)
In-process research and development . . . . . . . . . . . . . . . . . . . . — 1,000 —
Deferred income taxes and other. . . . . . . . . . . . . . . . . . . . . . . . (2,138) (9,175) (3,701)
Changes in assets and liabilities, net of acquisitions:
Accounts receivable . . . . . . . . . . . . . . . . . . . . . . . . . . . . . . . . . (31,212) (9,917) (66,651)
Inventories. . . . . . . . . . . . . . . . . . . . . . . . . . . . . . . . . . . . . . . . . (10,230) (11,478) (25,425)
Other assets . . . . . . . . . . . . . . . . . . . . . . . . . . . . . . . . . . . . . . . . (10,725) (8,637) (5,416)
Accounts payable . . . . . . . . . . . . . . . . . . . . . . . . . . . . . . . . . . . 61,096 33,890 5,162
Accrued liabilities . . . . . . . . . . . . . . . . . . . . . . . . . . . . . . . . . . . 48,893 41,777 33,537
Net cash provided by operating activities. . . . . . . . . . . . . 393,079 303,825 152,217
Cash flows from investing activities:
Purchases of property, plant and equipment . . . . . . . . . . . . . . . . . . . (57,900) (47,246) (54,102)
Purchases of short-term investments . . . . . . . . . . . . . . . . . . . . . . . . . (379,793) (416,475) —
Sales of short-term investments. . . . . . . . . . . . . . . . . . . . . . . . . . . . . 538,479 201,850 —
Sale of investment . . . . . . . . . . . . . . . . . . . . . . . . . . . . . . . . . . . . . . . 13,308 12,874 —
Acquisitions, net of cash acquired. . . . . . . . . . . . . . . . . . . . . . . . . . . (59,722) (20,524) 860
Premiums paid on cash surrender value life insurance policies . . . . (1,151) (537) (1,464)
Net cash provided by (used in) investing activities . . . . . 53,221 (270,058) (54,706)
Cash flows from financing activities:
Borrowings (repayments) of short-term debt . . . . . . . . . . . . . . . . . . (11,739) (2,181) 5,192
Purchases of treasury shares . . . . . . . . . . . . . . . . . . . . . . . . . . . . . . . (219,742) (138,095) (241,352)
Proceeds from sale of shares upon exercise of options
and purchase rights . . . . . . . . . . . . . . . . . . . . . . . . . . . . . . . . . . . . 50,603 44,706 49,206
Excess tax benefits from share-based compensation. . . . . . . . . . . . . 15,231 13,076 —
Net cash used in financing activities. . . . . . . . . . . . . . . . . (165,647) (82,494) (186,954)
Effect of exchange rate changes on cash and cash equivalents . . . . . . . . 5,502 (90) (6,820)
Net increase (decrease) in cash and cash equivalents. . . . 286,155 (48,817) (96,263)
Cash and cash equivalents at beginning of period . . . . . . . . . . . . . . . . . . 196,197 245,014 341,277
Cash and cash equivalents at end of period . . . . . . . . . . . . . . . . . . . . . . . $ 482,352 $ 196,197 $ 245,014
Supplemental cash flow information:
Interest paid . . . . . . . . . . . . . . . . . . . . . . . . . . . . . . . . . . . . . . . . . . . . $ 22 $ 178 $ 1,582
Income taxes paid . . . . . . . . . . . . . . . . . . . . . . . . . . . . . . . . . . . . . . . $ 11,655 $ 10,165 $ 6,456
Non-cash financing activities:
Conversion of convertible debt to registered shares . . . . . . . . . . . . . $ — $ — $ 138,674
The accompanying notes are an integral part of these consolidated financial statements.