Logitech 2008 Annual Report Download - page 109
Download and view the complete annual report
Please find page 109 of the 2008 Logitech annual report below. You can navigate through the pages in the report by either clicking on the pages listed below, or by using the keyword search tool below to find specific information within the annual report.-
 1
1 -
2
-
3
-
4
-
5
-
6
-
7
-
8
-
9
-
10
-
11
-
12
-
13
-
14
-
15
-
16
-
17
-
18
-
19
-
20
-
21
-
22
-
23
-
24
-
25
-
26
-
27
-
28
-
29
-
30
-
31
-
32
-
33
-
34
-
35
-
36
-
37
-
38
-
39
-
40
-
41
-
42
-
43
-
44
-
45
-
46
-
47
-
48
-
49
-
50
-
51
-
52
-
53
-
54
-
55
-
56
-
57
-
58
-
59
-
60
-
61
-
62
-
63
-
64
-
65
-
66
-
67
-
68
-
69
-
70
-
71
-
72
-
73
-
74
-
75
-
76
-
77
-
78
-
79
-
80
-
81
-
82
-
83
-
84
-
85
-
86
-
87
-
88
-
89
-
90
-
91
-
92
-
93
-
94
-
95
-
96
-
97
-
98
-
 99
99 -
 100
100 -
 101
101 -
 102
102 -
 103
103 -
 104
104 -
 105
105 -
 106
106 -
 107
107 -
 108
108 -
 109
109 -
 110
110 -
 111
111 -
 112
112 -
 113
113 -
 114
114 -
 115
115 -
 116
116 -
 117
117 -
 118
118 -
 119
119 -
120
-
121
-
122
-
123
-
124
 |
 |

F-39
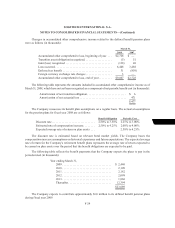
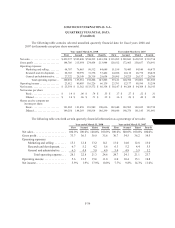
LOGITECH INTERNATIONAL S.A.
QUARTERLY FINANCIAL DATA
(Unaudited)
The following table contains selected unaudited quarterly financial data for fiscal years 2008 and
2007 (in thousands except per share amounts):
Year ended March 31, 2008 Year ended March 31, 2007
First Second Third Fourth First Second Third Fourth
Net sales....................... $429,537 $ 595,490 $744,235 $ 601,234 $ 393,282 $ 502,041 $ 658,512 $ 512,734
Gross profit .................... 144,786 215,954 274,434 213,944 120,912 172,965 238,657 176,991
Operating expenses:
Marketing and selling ........ 64,787 76,463 98,512 84,689 51,198 70,445 84,146 66,475
Research and development .... 28,765 30,939 31,378 33,462 24,928 26,118 28,778 28,432
General and administrative .... 27,322 28,149 28,318 29,654 20,995 24,225 26,137 26,786
Total operating expense . . 120,874 135,551 158,208 147,805 97,121 120,788 139,061 121,693
Operating income ............... 23,912 80,403 116,226 66,139 23,791 52,177 99,596 55,298
Net income..................... $ 25,554 $ 11,562 $133,572 $ 60,338 $ 30,147 $ 49,204 $ 94,304 $ 56,193
Net income per share:
Basic ..................... $ .14 $ .06 $ .74 $ .33 $ .17 $ .27 $ .52 $ .31
Diluted.................... $ .14 $ .06 $ .71 $ .32 $ .16 $ .26 $ .49 $ .29
Shares used to compute net
income per share:
Basic ..................... 181,802 181,459 181,549 180,636 182,648 182,502 182,652 182,738
Diluted.................... 189,250 188,293 188,814 186,299 190,646 190,276 191,145 191,091
The following table sets forth certain quarterly financial information as a percentage of net sales:
Year ended March 31, 2008 Year ended March 31, 2007
First Second Third Fourth First Second Third Fourth
Net sales....................... 100.0% 100.0% 100.0% 100.0% 100.0% 100.0% 100.0% 100.0%
Gross profit .................... 33.7 36.3 36.9 35.6 30.7 34.5 36.2 34.5
Operating expenses:
Marketing and selling ........ 15.1 12.8 13.2 14.1 13.0 14.0 12.8 13.0
Research and development..... 6.7 5.2 4.2 5.6 6.3 5.2 4.4 5.5
General and administrative .... 6.3 4.8 3.9 4.9 5.4 4.9 3.9 5.2
Total operating expense . . . 28.1 22.8 21.3 24.6 24.7 24.1 21.1 23.7
Operating income ............... 5.6 13.5 15.6 11.0 6.0 10.4 15.1 10.8
Net income..................... 5.9% 1.9% 17.9% 10.0% 7.7% 9.8% 14.3% 11.0%