Logitech 2008 Annual Report Download - page 34
Download and view the complete annual report
Please find page 34 of the 2008 Logitech annual report below. You can navigate through the pages in the report by either clicking on the pages listed below, or by using the keyword search tool below to find specific information within the annual report.-
 1
1 -
2
-
3
-
4
-
5
-
6
-
7
-
8
-
9
-
10
-
11
-
12
-
13
-
14
-
15
-
16
-
17
-
18
-
19
-
20
-
21
-
22
-
23
-
 24
24 -
 25
25 -
 26
26 -
 27
27 -
 28
28 -
 29
29 -
 30
30 -
 31
31 -
 32
32 -
 33
33 -
 34
34 -
 35
35 -
 36
36 -
 37
37 -
 38
38 -
 39
39 -
 40
40 -
 41
41 -
 42
42 -
 43
43 -
 44
44 -
45
-
46
-
47
-
48
-
49
-
50
-
51
-
52
-
53
-
54
-
55
-
56
-
57
-
58
-
59
-
60
-
61
-
62
-
63
-
64
-
65
-
66
-
67
-
68
-
69
-
70
-
71
-
72
-
73
-
74
-
75
-
76
-
77
-
78
-
79
-
80
-
81
-
82
-
83
-
84
-
85
-
86
-
87
-
88
-
89
-
90
-
91
-
92
-
93
-
94
-
95
-
96
-
97
-
98
-
99
-
100
-
101
-
102
-
103
-
104
-
105
-
106
-
107
-
108
-
109
-
110
-
111
-
112
-
113
-
114
-
115
-
116
-
117
-
118
-
119
-
120
-
121
-
122
-
123
-
124
 |
 |

12
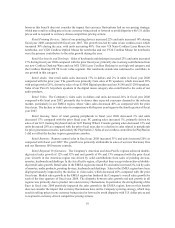
Research and Development
Research and development expense consists of personnel and related overhead costs, contractors and
outside consultants, supplies and materials, equipment depreciation and facilities costs, all associated with
the design and development of new products and enhancements of existing products.
The increase in research and development expense reflects our commitment to continued investment
in research and development initiatives, particularly in the audio, video and control devices product lines.
Increased personnel costs related to headcount additions in the last half of fiscal year 2007 were the
largest contributor to the increases in research and development expense for fiscal year 2008. The impact
of exchange rate changes on translation of foreign currency research and development expenses to the
Company’s U.S. dollar financial statements, particularly from the stronger Euro, Swiss franc and Canadian
dollar relative to the U.S. dollar, also contributed to the increase.
General and Administrative
General and administrative expense consists primarily of personnel and related overhead and facilities
costs for the finance, information systems, executive, human resources and legal functions.
General and administrative expense increased primarily as a result of an increase in personnel and
occupancy expenses. Personnel costs increased 19% during the year due to headcount increases in the latter
half of fiscal year 2007 to support new systems and internal control procedures implemented during fiscal
year 2007. Depreciation expense increased significantly compared with the prior fiscal year primarily due
to equipment and computer hardware purchases during f iscal year 2008. Rent expense also increased during
the year due to expanded facilities. The impact of exchange rate changes on translation of foreign currency
general and administrative expenses to the Company’s U.S. dollar financial statements, particularly from
the stronger Euro and Swiss franc relative to the U.S. dollar, also contributed to the increase.
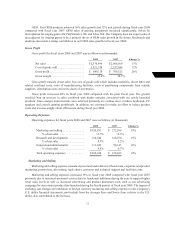
Interest Income, Net
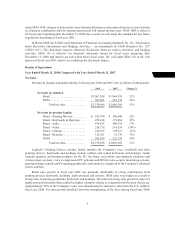
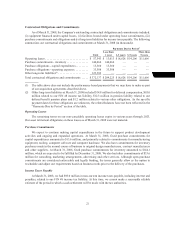
Interest income and expense for fiscal years 2008 and 2007 were as follows (in thousands):
2008 2007 Change %
Interest income .......................... $15,752 $ 9,083 73 %
Interest expense .......................... (244) (350) (30%)
Interest income, net ....................... $15,508 $ 8,733 78%
Interest income was higher for fiscal year 2008 due to higher invested balances in cash, short-term
bank deposits and short-term investments, and slightly higher returns earned on invested amounts.
Other Income, Net
Other income and expense for fiscal years 2008 and 2007 were as follows (in thousands):
2008 2007 Change %
Foreign currency exchange gains, net ......... $ 10,616 $ 6,190 72%
Gain on sale of investments, net ............. 27,761 9,048 207%
Write-off of investments ................... (79,823) — —
Other, net ............................... 2,072 724 186 %
Other income (expense), net ................. $(39,374) $15,962 (347%)