Logitech 2008 Annual Report Download - page 73
Download and view the complete annual report
Please find page 73 of the 2008 Logitech annual report below. You can navigate through the pages in the report by either clicking on the pages listed below, or by using the keyword search tool below to find specific information within the annual report.-
 1
1 -
2
-
3
-
4
-
5
-
6
-
7
-
8
-
9
-
10
-
11
-
12
-
13
-
14
-
15
-
16
-
17
-
18
-
19
-
20
-
21
-
22
-
23
-
24
-
25
-
26
-
27
-
28
-
29
-
30
-
31
-
32
-
33
-
34
-
35
-
36
-
37
-
38
-
39
-
40
-
41
-
42
-
43
-
44
-
45
-
46
-
47
-
48
-
49
-
50
-
51
-
52
-
53
-
54
-
55
-
56
-
57
-
58
-
59
-
60
-
61
-
62
-
 63
63 -
 64
64 -
 65
65 -
 66
66 -
 67
67 -
 68
68 -
 69
69 -
 70
70 -
 71
71 -
 72
72 -
 73
73 -
 74
74 -
 75
75 -
 76
76 -
 77
77 -
 78
78 -
 79
79 -
 80
80 -
 81
81 -
 82
82 -
 83
83 -
84
-
85
-
86
-
87
-
88
-
89
-
90
-
91
-
92
-
93
-
94
-
95
-
96
-
97
-
98
-
99
-
100
-
101
-
102
-
103
-
104
-
105
-
106
-
107
-
108
-
109
-
110
-
111
-
112
-
113
-
114
-
115
-
116
-
117
-
118
-
119
-
120
-
121
-
122
-
123
-
124
 |
 |

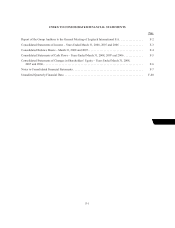
F-3
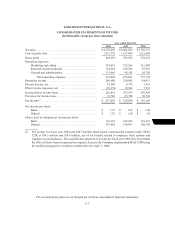
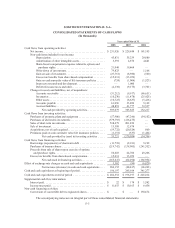
LOGITECH INTERNATIONAL S.A.
CONSOLIDATED STATEMENTS OF INCOME
(In thousands, except per share amounts)
Year ended March 31,
2008 2007 2006
Net sales. . . . . . . . . . . . . . . . . . . . . . . . . . . . . . . . . . . . . . . . . . $2,370,496 $ 2,066,569 $1,796,715
Cost of goods sold . . . . . . . . . . . . . . . . . . . . . . . . . . . . . . . . . . 1,521,378 1,357,044 1,222,605
Gross profit . . . . . . . . . . . . . . . . . . . . . . . . . . . . . . . . . . . . . . . 849,118 709,525 574,110
Operating expenses:
Marketing and selling . . . . . . . . . . . . . . . . . . . . . . . . . . . 324,451 272,264 221,504
Research and development. . . . . . . . . . . . . . . . . . . . . . . . 124,544 108,256 87,953
General and administrative . . . . . . . . . . . . . . . . . . . . . . . 113,443 98,143 65,742
Total operating expenses . . . . . . . . . . . . . . . . . . . . . 562,438 478,663 375,199
Operating income . . . . . . . . . . . . . . . . . . . . . . . . . . . . . . . . . . 286,680 230,862 198,911
Interest income, net . . . . . . . . . . . . . . . . . . . . . . . . . . . . . . . . . 15,508 8,733 3,591
Other income (expense), net . . . . . . . . . . . . . . . . . . . . . . . . . . (39,374) 15,962 7,352
Income before income taxes . . . . . . . . . . . . . . . . . . . . . . . . . . 262,814 255,557 209,854
Provision for income taxes . . . . . . . . . . . . . . . . . . . . . . . . . . . 31,788 25,709 28,749
Net income(1) . . . . . . . . . . . . . . . . . . . . . . . . . . . . . . . . . . . . . . $ 231,026 $ 229,848 $ 181,105
Net income per share:
Basic. . . . . . . . . . . . . . . . . . . . . . . . . . . . . . . . . . . . . . . . . $ 1.27 $ 1.26 $ 1.00
Diluted . . . . . . . . . . . . . . . . . . . . . . . . . . . . . . . . . . . . . . . $ 1.23 $ 1.20 $ .92
Shares used to compute net income per share:
Basic. . . . . . . . . . . . . . . . . . . . . . . . . . . . . . . . . . . . . . . . . 181,362 182,635 181,361
Diluted . . . . . . . . . . . . . . . . . . . . . . . . . . . . . . . . . . . . . . . 187,942 190,991 198,769
(1) Net income for fiscal year 2008 and 2007 includes share-based compensation expense under SFAS
123R of $16.3 million and $14.9 million, net of tax benefit, related to employee stock options and
employee stock purchases. The consolidated statement of income for fiscal year 2006 does not include
the effect of share-based compensation expense, because the Company implemented SFAS 123R using
the modified prospective transition method effective April 1, 2006.
The accompanying notes are an integral part of these consolidated financial statements.