Logitech 2008 Annual Report Download - page 40
Download and view the complete annual report
Please find page 40 of the 2008 Logitech annual report below. You can navigate through the pages in the report by either clicking on the pages listed below, or by using the keyword search tool below to find specific information within the annual report.-
 1
1 -
2
-
3
-
4
-
5
-
6
-
7
-
8
-
9
-
10
-
11
-
12
-
13
-
14
-
15
-
16
-
17
-
18
-
19
-
20
-
21
-
22
-
23
-
24
-
25
-
26
-
27
-
28
-
29
-
 30
30 -
 31
31 -
 32
32 -
 33
33 -
 34
34 -
 35
35 -
 36
36 -
 37
37 -
 38
38 -
 39
39 -
 40
40 -
 41
41 -
 42
42 -
 43
43 -
 44
44 -
 45
45 -
 46
46 -
 47
47 -
 48
48 -
 49
49 -
 50
50 -
51
-
52
-
53
-
54
-
55
-
56
-
57
-
58
-
59
-
60
-
61
-
62
-
63
-
64
-
65
-
66
-
67
-
68
-
69
-
70
-
71
-
72
-
73
-
74
-
75
-
76
-
77
-
78
-
79
-
80
-
81
-
82
-
83
-
84
-
85
-
86
-
87
-
88
-
89
-
90
-
91
-
92
-
93
-
94
-
95
-
96
-
97
-
98
-
99
-
100
-
101
-
102
-
103
-
104
-
105
-
106
-
107
-
108
-
109
-
110
-
111
-
112
-
113
-
114
-
115
-
116
-
117
-
118
-
119
-
120
-
121
-
122
-
123
-
124
 |
 |

18
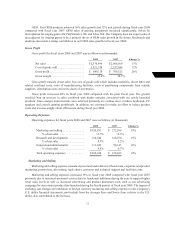
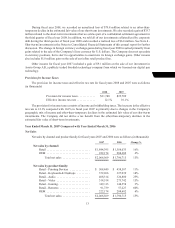
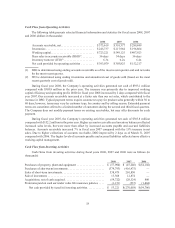
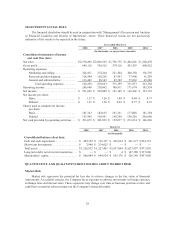
Cash Flow from Operating Activities
The following table presents selected financial information and statistics for fiscal years 2008, 2007
and 2006 (dollars in thousands):
2008 2007 2006
Accounts receivable, net ....................... $373,619 $ 310,377 $ 289,849
Inventories ................................. $245,737 $ 217,964 $ 196,864
Working capital .............................. $723,221 $ 549,125 $ 407,923
Days sales in accounts receivable (DSO)(1)......... 56 days 54 days 56 days
Inventory turnover (ITO)(2) ..................... 6.3x 6.2x 6.4x
Net cash provided by operating activities ......... $393,079 $ 303,825 $ 152,217
(1) DSO is determined using ending accounts receivable as of the most recent quarter-end and net sales
for the most recent quarter.
(2) ITO is determined using ending inventories and annualized cost of goods sold (based on the most
recent quarterly cost of goods sold).
During fiscal year 2008, the Company’s operating activities generated net cash of $393.1 million
compared with $303.8 million in the prior year. The increase was primarily due to improved working
capital efficiency and operating profit. DSO for fiscal year 2008 increased by 2 days compared with fiscal
year 2007. Our accounts receivable increased at a faster rate than our net sales, which contributed to the
increase in DSO. Typical payment terms require customers to pay for product sales generally within 30 to
60 days; however, terms may vary by customer type, by country and by selling season. Extended payment
terms are sometimes offered to a limited number of customers during the second and third fiscal quarters.
The Company does not modify payment terms on existing receivables, but may offer discounts for early
payment.
During fiscal year 2007, the Company’s operating activities generated net cash of $303.8 million
compared with $152.2 million in the prior year. Higher accounts receivable and inventory balances reflected
increased sales levels, but were more than offset by increased accounts payable and accrued liabilities
balances. Accounts receivable increased 7% in fiscal year 2007 compared with the 15% increase in net
sales. Due to higher collections of accounts receivable, DSO improved by 2 days as of March 31, 2007
compared with 2006. The higher levels of accounts payable and accrued liabilities reflected more effective
working capital management.
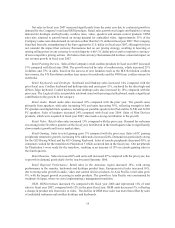
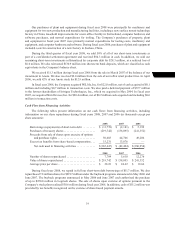
Cash Flow from Investing Activities
Cash flows from investing activities during fiscal years 2008, 2007 and 2006 were as follows (in
thousands):
2008 2007 2006
Purchases of property, plant and equipment ................... $ (57,900) $ (47,246) $(54,102)
Purchases of short-term investments ......................... (379,793) (416,475) —
Sales of short-term investments ............................. 538,479 201,850 —
Sale of investment ........................................ 13,308 12,874 —
Acquisitions, net of cash acquired ........................... (59,722) (20,524) 860
Premiums paid on cash surrender value life insurance policies .... (1,151) (537) (1,464)
Net cash provided by (used in) investing activities ............ $ 53,221 $(270,058) $(54,706)