Logitech 2007 Annual Report Download - page 98
Download and view the complete annual report
Please find page 98 of the 2007 Logitech annual report below. You can navigate through the pages in the report by either clicking on the pages listed below, or by using the keyword search tool below to find specific information within the annual report.-
 1
1 -
2
-
3
-
4
-
5
-
6
-
7
-
8
-
9
-
10
-
11
-
12
-
13
-
14
-
15
-
16
-
17
-
18
-
19
-
20
-
21
-
22
-
23
-
24
-
25
-
26
-
27
-
28
-
29
-
30
-
31
-
32
-
33
-
34
-
35
-
36
-
37
-
38
-
39
-
40
-
41
-
42
-
43
-
44
-
45
-
46
-
47
-
48
-
49
-
50
-
51
-
52
-
53
-
54
-
55
-
56
-
57
-
58
-
59
-
60
-
61
-
62
-
63
-
64
-
65
-
66
-
67
-
68
-
69
-
70
-
71
-
72
-
73
-
74
-
75
-
76
-
77
-
78
-
79
-
80
-
81
-
82
-
83
-
84
-
85
-
86
-
87
-
 88
88 -
 89
89 -
 90
90 -
 91
91 -
 92
92 -
 93
93 -
 94
94 -
 95
95 -
 96
96 -
 97
97 -
 98
98 -
 99
99 -
 100
100 -
 101
101 -
 102
102 -
 103
103 -
 104
104 -
 105
105 -
 106
106 -
 107
107 -
 108
108 -
109
-
110
-
111
-
112
-
113
-
114
-
115
-
116
-
117
-
118
-
119
-
120
-
121
-
122
-
123
-
124
-
125
-
126
-
127
-
128
-
129
-
130
-
131
-
132
-
133
-
134
-
135
-
136
-
137
-
138
-
139
-
140
-
141
-
142
-
143
-
144
-
145
-
146
-
147
-
148
-
149
-
150
-
151
-
152
-
153
-
154
-
155
-
156
-
157
-
158
-
159
-
160
-
161
-
162
-
163
-
164
-
165
-
166
 |
 |

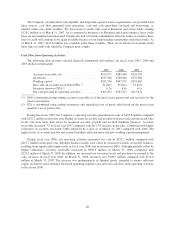
The Company’s normal short-term liquidity and long-term capital resource requirements are provided from
three sources: cash flow generated from operations, cash and cash equivalents on hand and borrowings, as
needed, under our credit facilities. We have lines of credit with several European and Asian banks totaling
$126.2 million as of March 31, 2007. As is common for businesses in European and Asian countries, these credit
lines are uncommitted and unsecured. Despite the lack of formal commitments from our banks, we believe these
lines of credit will continue to be made available because of our long-standing relationships with these banks. As
of March 31, 2007, $112.0 million was available under these facilities. There are no financial covenants under
these lines of credit with which the Company must comply.
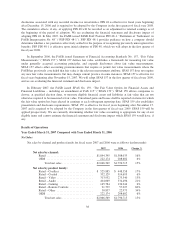
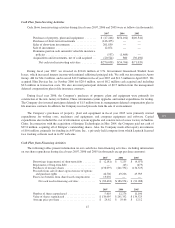
Cash Flow from Operating Activities
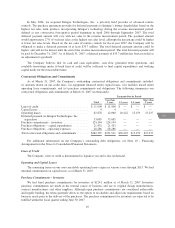
The following table presents selected financial information and statistics for fiscal years 2007, 2006 and
2005 (dollars in thousands):
2007 2006 2005
Accounts receivable, net ....................... $310,377 $289,849 $229,234
Inventories .................................. $217,964 $196,864 $175,986
Working capital .............................. $542,356 $407,923 $452,663
Days sales in accounts receivable (DSO) (1) ......... 54days 56 days 51 days
Inventory turnover (ITO) (2) ..................... 6.2x 6.4x 6.1x
Net cash provided by operating activities .......... $303,825 $152,217 $213,674
(1) DSO is determined using ending accounts receivable as of the most recent quarter-end and net sales for the
most recent quarter.
(2) ITO is determined using ending inventories and annualized cost of goods sold (based on the most recent
quarterly cost of goods sold).
During fiscal year 2007, the Company’s operating activities generated net cash of $303.8 million compared
with $152.2 million in the prior year. Higher accounts receivable and inventory balances reflected increased sales
levels, but were more than offset by increased accounts payable and accrued liabilities balances. Accounts
receivable increased 7% in fiscal year 2007 compared with the 15% increase in net sales. Combined with higher
collections of accounts receivable, DSO improved by 2 days as of March 31, 2007 compared with 2006. The
higher levels of accounts payable and accrued liabilities reflected more effective working capital management.
During fiscal year 2006, our operating activities generated net cash of $152.2 million compared with
$213.7 million in the prior year. Stronger business results were offset by increased accounts receivable balances,
resulting from significantly higher sales in fiscal year 2006 and an increase in DSO. Although partially offset by
higher collections, accounts receivable increased to $289.8 million at March 31, 2006, compared with
$229.2 million at March 31, 2005. In addition, we increased our inventory levels and purchases to respond to the
sales increases in fiscal year 2006. At March 31, 2006, inventory was $196.9 million compared with $176.0
million at March 31, 2005. The increase was predominantly in finished goods, intended to ensure sufficient
supply on hand to meet demand. Increased operating expenses also affected cash flow from operating activities
in fiscal year 2006.
46