Logitech 2007 Annual Report Download - page 92
Download and view the complete annual report
Please find page 92 of the 2007 Logitech annual report below. You can navigate through the pages in the report by either clicking on the pages listed below, or by using the keyword search tool below to find specific information within the annual report.-
 1
1 -
2
-
3
-
4
-
5
-
6
-
7
-
8
-
9
-
10
-
11
-
12
-
13
-
14
-
15
-
16
-
17
-
18
-
19
-
20
-
21
-
22
-
23
-
24
-
25
-
26
-
27
-
28
-
29
-
30
-
31
-
32
-
33
-
34
-
35
-
36
-
37
-
38
-
39
-
40
-
41
-
42
-
43
-
44
-
45
-
46
-
47
-
48
-
49
-
50
-
51
-
52
-
53
-
54
-
55
-
56
-
57
-
58
-
59
-
60
-
61
-
62
-
63
-
64
-
65
-
66
-
67
-
68
-
69
-
70
-
71
-
72
-
73
-
74
-
75
-
76
-
77
-
78
-
79
-
80
-
81
-
 82
82 -
 83
83 -
 84
84 -
 85
85 -
 86
86 -
 87
87 -
 88
88 -
 89
89 -
 90
90 -
 91
91 -
 92
92 -
 93
93 -
 94
94 -
 95
95 -
 96
96 -
 97
97 -
 98
98 -
 99
99 -
 100
100 -
 101
101 -
 102
102 -
103
-
104
-
105
-
106
-
107
-
108
-
109
-
110
-
111
-
112
-
113
-
114
-
115
-
116
-
117
-
118
-
119
-
120
-
121
-
122
-
123
-
124
-
125
-
126
-
127
-
128
-
129
-
130
-
131
-
132
-
133
-
134
-
135
-
136
-
137
-
138
-
139
-
140
-
141
-
142
-
143
-
144
-
145
-
146
-
147
-
148
-
149
-
150
-
151
-
152
-
153
-
154
-
155
-
156
-
157
-
158
-
159
-
160
-
161
-
162
-
163
-
164
-
165
-
166
 |
 |

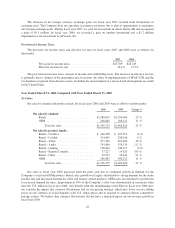
sales growth in audio, video and cordless products. In Asia Pacific, retail sales grew 6%, with the largest growth
occurring in audio products. The growth in Asia Pacific was constrained by weakness in Japan, where we are
implementing a management transition.
OEM. OEM revenues increased 6% compared with fiscal year 2006 and represented 11% of total sales in
fiscal year 2007, compared with 12% in the prior fiscal year. OEM units decreased 1%, reflecting a change in
product mix from mice to video. The decline in OEM mice sales was more than offset by sales of embedded
webcams and cordless desktops and keyboards.
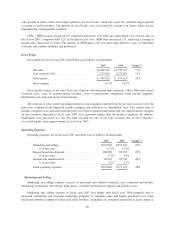
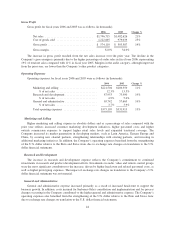
Gross Profit
Gross profit for fiscal years 2007 and 2006 was as follows (in thousands):
2007 2006 Change %
Net sales ................................. $2,066,569 $1,796,715 15%
Cost of goods sold ......................... 1,357,044 1,222,605 11%
Gross profit ............................... $ 709,525 $ 574,110 24%
Gross margin .............................. 34.3% 32.0%
Gross profit consists of net sales, less cost of goods sold which includes materials, direct labor and related
overhead costs, costs of manufacturing facilities, costs of purchasing components from outside suppliers,
distribution costs and write-down of inventories.
The increase in gross profit and improvement in gross margin resulted from the net sales increase over the
prior year combined with improved product margins and reductions in distribution costs. The relative mix of
product categories was consistent with the prior year. Due to product innovation and cost improvements, margins
on new products launched in fiscal year 2007 were generally higher than the products replaced. In addition,
distribution costs increased at a rate less than one-half the rate of net sales increase, due to the Company’s
successful supply chain improvements in fiscal year 2007.
Operating Expenses
Operating expenses for fiscal years 2007 and 2006 were as follows (in thousands):
2007 2006 Change %
Marketing and selling .......................... $272,264 $221,504 23%
% of net sales ............................ 13.2% 12.3%
Research and development ...................... 108,256 87,953 23%
% of net sales ............................ 5.2% 4.9%
General and administrative ...................... 98,143 65,742 49%
% of net sales ............................ 4.7% 3.7%
Total operating expenses ....................... $478,663 $375,199 28%
Marketing and Selling
Marketing and selling expense consists of personnel and related overhead costs, corporate and product
marketing, promotions, advertising, trade shows, customer and technical support and facilities costs.
Marketing and selling expense in fiscal year 2007 was higher than fiscal year 2006 primarily due to
increased advertising and customer marketing programs to stimulate sales and higher personnel costs from
headcount growth in support of increased retail business, including our continued expansion in Latin America,
40