Logitech 2007 Annual Report Download - page 2
Download and view the complete annual report
Please find page 2 of the 2007 Logitech annual report below. You can navigate through the pages in the report by either clicking on the pages listed below, or by using the keyword search tool below to find specific information within the annual report.-
 1
1 -
 2
2 -
 3
3 -
 4
4 -
 5
5 -
 6
6 -
 7
7 -
 8
8 -
 9
9 -
 10
10 -
 11
11 -
 12
12 -
 13
13 -
14
-
15
-
16
-
17
-
18
-
19
-
20
-
21
-
22
-
23
-
24
-
25
-
26
-
27
-
28
-
29
-
30
-
31
-
32
-
33
-
34
-
35
-
36
-
37
-
38
-
39
-
40
-
41
-
42
-
43
-
44
-
45
-
46
-
47
-
48
-
49
-
50
-
51
-
52
-
53
-
54
-
55
-
56
-
57
-
58
-
59
-
60
-
61
-
62
-
63
-
64
-
65
-
66
-
67
-
68
-
69
-
70
-
71
-
72
-
73
-
74
-
75
-
76
-
77
-
78
-
79
-
80
-
81
-
82
-
83
-
84
-
85
-
86
-
87
-
88
-
89
-
90
-
91
-
92
-
93
-
94
-
95
-
96
-
97
-
98
-
99
-
100
-
101
-
102
-
103
-
104
-
105
-
106
-
107
-
108
-
109
-
110
-
111
-
112
-
113
-
114
-
115
-
116
-
117
-
118
-
119
-
120
-
121
-
122
-
123
-
124
-
125
-
126
-
127
-
128
-
129
-
130
-
131
-
132
-
133
-
134
-
135
-
136
-
137
-
138
-
139
-
140
-
141
-
142
-
143
-
144
-
145
-
146
-
147
-
148
-
149
-
150
-
151
-
152
-
153
-
154
-
155
-
156
-
157
-
158
-
159
-
160
-
161
-
162
-
163
-
164
-
165
-
166
 |
 |

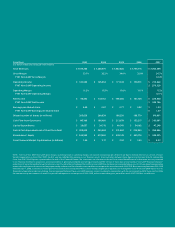
Fiscal Year 2003 2004 2005 2006 2007
(U.S. dollars in thousands, except per share amounts)
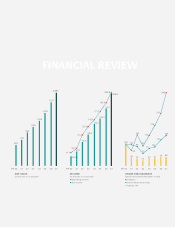
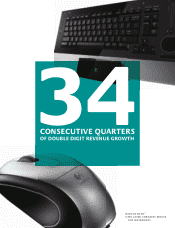
Total Revenues $ 1,100,288 $ 1,268,470 $ 1,482,626 $ 1,796,715 $ 2,066,569
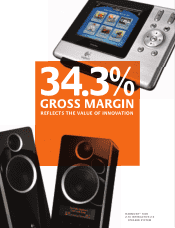
Gross Margin 33.1% 32.2% 34.0% 32.0% 34.3%
FY07 Non-GAAP Gross Margin 34.4%
Operating Income $ 123,882 $ 145,554 $ 171,674 $ 198,911 $ 230,862
FY07 Non-GAAP Operating Income $ 250,326
Operating Margin 11.3% 11.5% 11.6% 11.1% 11.2%
FY07 Non-GAAP Operating Margin 12.1%
Net Income $ 98,843 $ 132,153 $ 149,266 $ 181,105 $ 229,848
FY07 Non-GAAP Net Income $ 244,786
Earnings per diluted share $ 0.49 $ 0.67 $ 0.77 $ 0.92 $ 1.20
FY07 Non-GAAP Earnings per diluted share $ 1.27
Diluted number of shares (in millions) 205,638 200,639 198,250 198,770 190,991
Cash Flow from Operations $ 145,108 $ 166,460 $ 213,674 $ 152,217 $ 305,681
Capital Expenditures $ 28,657 $ 24,718 $ 40,541 $ 54,102 $ 47,246
Cash & Cash Equivalents net of Short-Term Debt $ 208,632 $ 280,624 $ 331,402 $ 230,943 $ 398,966
Shareholders’ Equity $ 365,562 $ 457,080 $ 526,149 $ 685,176 $ 844,525
Fiscal Year-end Market Capitalization (in billions) $ 1.40 $ 2.17 $ 2.92 $ 3.80 $ 5.32
NOTE: The Fiscal Year 2007 Non-GAAP gross margin, operating income, operating margin, net income and earnings per diluted share fi gures exclude the cost or net cost of share-
based compensation in Fiscal Year 2007, the fi rst year we refl ected this expense in our fi nancial results. A reconciliation between these fi gures and the most directly comparable
Fiscal Year 2007 GAAP fi gures is presented at the end of this Financial Review. We sometimes use information derived from consolidated fi nancial information but not presented
in our fi nancial statements prepared in accordance with U.S. generally accepted accounting principles (GAAP). Certain of these data are considered “non-GAAP fi nancial measures”
under the U.S. Securities and Exchange Commission rules. The adjustments between the GAAP and non-GAAP fi nancial measures presented above consist of share-based compensation
expense for employee stock options and employee stock purchases, and the related income tax effect, as recognized in accordance with SFAS 123R. Because we implemented SFAS 123R
effective April 1, 2006, our fi nancial results prior to this time do not include the effect of share-based compensation expense. Our management uses these non-GAAP measures in its
fi nancial and operational decision-making. Our management believes these non-GAAP measures, when considered in conjunction with the corresponding GAAP measures, facilitate
the comparison by our investors of results for periods subsequent to our adoption of SFAS 123R, with corresponding prior periods for which SFAS 123R was not effective.