Logitech 2007 Annual Report Download - page 135
Download and view the complete annual report
Please find page 135 of the 2007 Logitech annual report below. You can navigate through the pages in the report by either clicking on the pages listed below, or by using the keyword search tool below to find specific information within the annual report.-
 1
1 -
2
-
3
-
4
-
5
-
6
-
7
-
8
-
9
-
10
-
11
-
12
-
13
-
14
-
15
-
16
-
17
-
18
-
19
-
20
-
21
-
22
-
23
-
24
-
25
-
26
-
27
-
28
-
29
-
30
-
31
-
32
-
33
-
34
-
35
-
36
-
37
-
38
-
39
-
40
-
41
-
42
-
43
-
44
-
45
-
46
-
47
-
48
-
49
-
50
-
51
-
52
-
53
-
54
-
55
-
56
-
57
-
58
-
59
-
60
-
61
-
62
-
63
-
64
-
65
-
66
-
67
-
68
-
69
-
70
-
71
-
72
-
73
-
74
-
75
-
76
-
77
-
78
-
79
-
80
-
81
-
82
-
83
-
84
-
85
-
86
-
87
-
88
-
89
-
90
-
91
-
92
-
93
-
94
-
95
-
96
-
97
-
98
-
99
-
100
-
101
-
102
-
103
-
104
-
105
-
106
-
107
-
108
-
109
-
110
-
111
-
112
-
113
-
114
-
115
-
116
-
117
-
118
-
119
-
120
-
121
-
122
-
123
-
124
-
 125
125 -
 126
126 -
 127
127 -
 128
128 -
 129
129 -
 130
130 -
 131
131 -
 132
132 -
 133
133 -
 134
134 -
 135
135 -
 136
136 -
 137
137 -
 138
138 -
 139
139 -
 140
140 -
 141
141 -
 142
142 -
 143
143 -
 144
144 -
 145
145 -
146
-
147
-
148
-
149
-
150
-
151
-
152
-
153
-
154
-
155
-
156
-
157
-
158
-
159
-
160
-
161
-
162
-
163
-
164
-
165
-
166
 |
 |

LOGITECH INTERNATIONAL S.A.
NOTES TO CONSOLIDATED FINANCIAL STATEMENTS—(Continued)
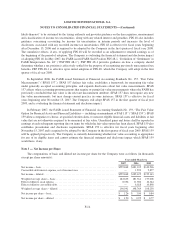
As a result of adopting SFAS 123R, basic earnings per share for fiscal year 2007 was $0.08 per share lower
and diluted earnings per share for fiscal year 2007 was $0.07 per share lower.
For fiscal year 2007, $0.7 million of share based compensation was capitalized to inventory. For fiscal years
2006 and 2005, no share-based compensation cost was capitalized to inventory. As of March 31, 2007, total
compensation cost related to non-vested stock options not yet recognized was $29.2 million, which is expected to
be recognized over the next 36 months on a weighted-average basis.
Pro Forma Information
Prior to the adoption of SFAS 123R, the Company provided the disclosures required under SFAS 123, as
amended by SFAS No. 148, “Accounting for Stock-Based Compensation – Transition and Disclosures.” No
employee share-based compensation expense was reflected in the results of operations for fiscal years 2006 and
2005 for employee stock option awards as all options were granted with an exercise price equal to the market
value of the underlying common stock on the date of grant. The employee stock purchases were deemed
non-compensatory under the provisions of APB 25.
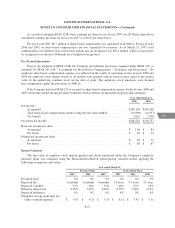
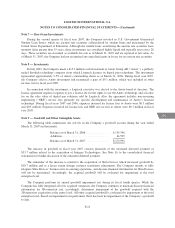
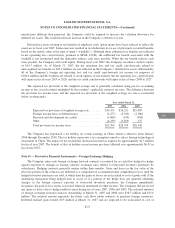
If the Company had used SFAS 123 to account for share-based compensation expense for fiscal years 2006 and
2005, net income and net income per share would have been as follows (in thousands except per-share amounts):
Year ended March 31,
2006 2005
Net income:
As reported .......................................................... $181,105 $149,266
Total share-based compensation expense using the fair value method ............. (19,896) (24,507)
Tax benefit ........................................................... 5,014 5,998
Pro forma net income ...................................................... $166,223 $130,757
Basic net income per share:
As reported .......................................................... $ 1.00 $ .84
Pro forma ............................................................ $ .92 $ .74
Diluted net income per share:
As reported .......................................................... $ .92 $ .77
Pro forma ............................................................ $ .84 $ .67
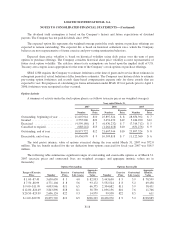
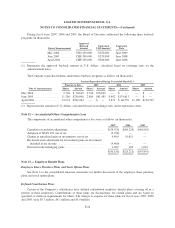
Option Valuation
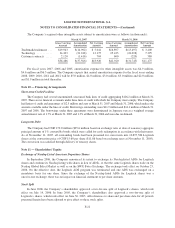
The fair value of employee stock options granted and shares purchased under the Company’s employee
purchase plans was estimated using the Black-Scholes-Merton option-pricing valuation model applying the
following assumptions and values:
Year ended March 31,
Purchase Plans Stock Option Plans
2007 2006 2005 2007 2006 2005
Dividend yield ................ 0% 0% 0% 0% 0% 0%
Expected life .................. 6months 6 months 6 months 3.9 years 3.7 years 3.5 years
Expected volatility ............. 33% 26% 33% 40% 47% 58%
Risk-free interest rate ........... 4.98% 3.67% 2.06% 4.75% 4.16% 3.15%
Expected forfeitures ............ 0% 0% 0% 8% 0% 0%
Weighted average grant-date fair
value of options granted ....... $ 5.87 $ 4.21 $ 3.13 $ 8.11 $ 7.47 $ 5.11
F-17
CG