Logitech 2007 Annual Report Download - page 57
Download and view the complete annual report
Please find page 57 of the 2007 Logitech annual report below. You can navigate through the pages in the report by either clicking on the pages listed below, or by using the keyword search tool below to find specific information within the annual report.-
 1
1 -
2
-
3
-
4
-
5
-
6
-
7
-
8
-
9
-
10
-
11
-
12
-
13
-
14
-
15
-
16
-
17
-
18
-
19
-
20
-
21
-
22
-
23
-
24
-
25
-
26
-
27
-
28
-
29
-
30
-
31
-
32
-
33
-
34
-
35
-
36
-
37
-
38
-
39
-
40
-
41
-
42
-
43
-
44
-
45
-
46
-
 47
47 -
 48
48 -
 49
49 -
 50
50 -
 51
51 -
 52
52 -
 53
53 -
 54
54 -
 55
55 -
 56
56 -
 57
57 -
 58
58 -
 59
59 -
 60
60 -
 61
61 -
 62
62 -
 63
63 -
 64
64 -
 65
65 -
 66
66 -
 67
67 -
68
-
69
-
70
-
71
-
72
-
73
-
74
-
75
-
76
-
77
-
78
-
79
-
80
-
81
-
82
-
83
-
84
-
85
-
86
-
87
-
88
-
89
-
90
-
91
-
92
-
93
-
94
-
95
-
96
-
97
-
98
-
99
-
100
-
101
-
102
-
103
-
104
-
105
-
106
-
107
-
108
-
109
-
110
-
111
-
112
-
113
-
114
-
115
-
116
-
117
-
118
-
119
-
120
-
121
-
122
-
123
-
124
-
125
-
126
-
127
-
128
-
129
-
130
-
131
-
132
-
133
-
134
-
135
-
136
-
137
-
138
-
139
-
140
-
141
-
142
-
143
-
144
-
145
-
146
-
147
-
148
-
149
-
150
-
151
-
152
-
153
-
154
-
155
-
156
-
157
-
158
-
159
-
160
-
161
-
162
-
163
-
164
-
165
-
166
 |
 |

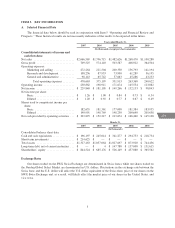
ITEM 3. KEY INFORMATION
A. Selected Financial Data
The financial data below should be read in conjunction with Item 5 “Operating and Financial Review and
Prospects.” These historical results are not necessarily indicative of the results to be expected in the future.
Year ended March 31,
2007 2006 2005 2004 2003
(In thousands, except per share amounts)
Consolidated statements of income and
cash flow data:
Net sales ............................ $2,066,569 $1,796,715 $1,482,626 $1,268,470 $1,100,288
Gross profit .......................... 709,525 574,110 503,587 408,922 364,504
Operating expenses:
Marketing and selling .............. 272,264 221,504 200,350 156,793 141,194
Research and development .......... 108,256 87,953 73,900 61,289 56,195
General and administrative .......... 98,143 65,742 57,663 45,286 43,233
Total operating expenses ........ 478,663 375,199 331,913 263,368 240,622
Operating income ..................... 230,862 198,911 171,674 145,554 123,882
Net income .......................... $ 229,848 $ 181,105 $ 149,266 $ 132,153 $ 98,843
Net income per share:
Basic ........................... $ 1.26 $ 1.00 $ 0.84 $ 0.73 $ 0.54
Diluted .......................... $ 1.20 $ 0.92 $ 0.77 $ 0.67 $ 0.49
Shares used to compute net income per
share:
Basic ........................... 182,635 181,361 177,008 181,384 183,955
Diluted .......................... 190,991 198,769 198,250 200,640 205,638
Net cash provided by operating activities . . . $ 303,825 $ 152,217 $ 213,674 $ 166,460 $ 145,108
March 31,
2007 2006 2005 2004 2003
(In thousands)
Consolidated balance sheet data:
Cash and cash equivalents ............... $ 196,197 $ 245,014 $ 341,277 $ 294,753 $ 218,734
Short-term investments ................. $ 214,625 $ — $ — $ — $ —
Total assets .......................... $1,327,463 $1,057,064 $1,027,697 $ 873,920 $ 744,456
Long-term debt, net of current maturities . . . $ — $ 4 $ 147,788 $ 137,008 $ 131,615
Shareholders’ equity ................... $ 844,524 $ 685,176 $ 526,149 $ 457,080 $ 365,562
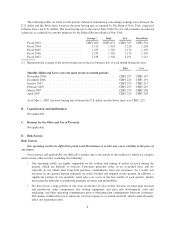
Exchange Rates
Our shares traded on the SWX Swiss Exchange are denominated in Swiss francs while our shares traded on
the Nasdaq Global Select Market are denominated in U.S. dollars. Fluctuations in the exchange rate between the
Swiss franc and the U.S. dollar will affect the U.S. dollar equivalent of the Swiss franc price of our shares on the
SWX Swiss Exchange and, as a result, will likely affect the market price of our shares in the United States, and
vice versa.
5
CG