Logitech 2007 Annual Report Download - page 136
Download and view the complete annual report
Please find page 136 of the 2007 Logitech annual report below. You can navigate through the pages in the report by either clicking on the pages listed below, or by using the keyword search tool below to find specific information within the annual report.-
 1
1 -
2
-
3
-
4
-
5
-
6
-
7
-
8
-
9
-
10
-
11
-
12
-
13
-
14
-
15
-
16
-
17
-
18
-
19
-
20
-
21
-
22
-
23
-
24
-
25
-
26
-
27
-
28
-
29
-
30
-
31
-
32
-
33
-
34
-
35
-
36
-
37
-
38
-
39
-
40
-
41
-
42
-
43
-
44
-
45
-
46
-
47
-
48
-
49
-
50
-
51
-
52
-
53
-
54
-
55
-
56
-
57
-
58
-
59
-
60
-
61
-
62
-
63
-
64
-
65
-
66
-
67
-
68
-
69
-
70
-
71
-
72
-
73
-
74
-
75
-
76
-
77
-
78
-
79
-
80
-
81
-
82
-
83
-
84
-
85
-
86
-
87
-
88
-
89
-
90
-
91
-
92
-
93
-
94
-
95
-
96
-
97
-
98
-
99
-
100
-
101
-
102
-
103
-
104
-
105
-
106
-
107
-
108
-
109
-
110
-
111
-
112
-
113
-
114
-
115
-
116
-
117
-
118
-
119
-
120
-
121
-
122
-
123
-
124
-
125
-
 126
126 -
 127
127 -
 128
128 -
 129
129 -
 130
130 -
 131
131 -
 132
132 -
 133
133 -
 134
134 -
 135
135 -
 136
136 -
 137
137 -
 138
138 -
 139
139 -
 140
140 -
 141
141 -
 142
142 -
 143
143 -
 144
144 -
 145
145 -
 146
146 -
147
-
148
-
149
-
150
-
151
-
152
-
153
-
154
-
155
-
156
-
157
-
158
-
159
-
160
-
161
-
162
-
163
-
164
-
165
-
166
 |
 |

LOGITECH INTERNATIONAL S.A.
NOTES TO CONSOLIDATED FINANCIAL STATEMENTS—(Continued)
The dividend yield assumption is based on the Company’s history and future expectations of dividend
payouts. The Company has not paid dividends since 1996.
The expected option life represents the weighted-average period the stock options or purchase offerings are
expected to remain outstanding. The expected life is based on historical settlement rates, which the Company
believes are most representative of future exercise and post-vesting termination behaviors.
Expected share price volatility is based on historical volatility using daily prices over the term of past
options or purchase offerings. The Company considers historical share price volatility as most representative of
future stock option volatility. The risk-free interest rate assumptions are based upon the implied yield of U.S.
Treasury zero-coupon issues appropriate for the term of the Company’s stock options or purchase offerings.
SFAS 123R requires the Company to estimate forfeitures at the time of grant and to revise those estimates in
subsequent periods if actual forfeitures differ from those estimates. The Company uses historical data to estimate
pre-vesting option forfeitures and records share-based compensation expense only for those awards that are
expected to vest. For purposes of calculating pro forma information under SFAS 123 for periods prior to April 1,
2006, forfeitures were recognized as they occurred.
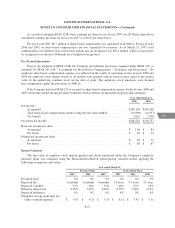
Option Activity
A summary of activity under the stock option plans is as follows (exercise prices are weighted averages):
Year ended March 31,
2007 2006 2005
Number
Exercise
Price Number
Exercise
Price Number
Exercise
Price
Outstanding, beginning of year ......... 21,607,944 $10 25,897,324 $ 8 28,656,392 $ 7
Granted ............................ 2,555,200 $22 3,451,470 $19 5,186,920 $12
Exercised .......................... (4,599,180) $ 7 (6,476,232) $ 7 (7,314,712) $ 5
Cancelled or expired .................. (688,242) $13 (1,264,618) $10 (631,276) $ 9
Outstanding, end of year ............... 18,875,722 $12 21,607,944 $10 25,897,324 $ 8
Exercisable, end of year ............... 10,436,970 $ 9 10,509,818 $ 7 11,122,360 $ 6
The total pretax intrinsic value of options exercised during the year ended March 31, 2007 was $72.0
million. The tax benefit realized for the tax deduction from options exercised for fiscal year 2007 was $16.5
million.
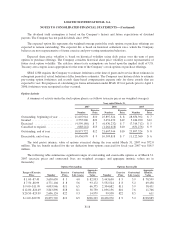
The following table summarizes significant ranges of outstanding and exercisable options as of March 31,
2007 (exercise prices and contractual lives are weighted averages, and aggregate intrinsic values are in
thousands):
Options Outstanding Options Exercisable
Range of Exercise
Price Number
Exercise
Price
Contractual
Life (years)
Aggregate
Intrinsic
Value Number
Exercise
Price
Contractual
Life (years)
Aggregate
Intrinsic
Value
$ 1.00 -$7.49 3,650,650 $ 5 4.0 $ 82,953 3,443,650 $ 5 3.9 $ 78,599
$ 7.50 -$8.99 4,771,104 $ 8 5.6 93,172 3,552,524 $ 8 5.2 69,458
$ 9.00 -$11.99 4,003,946 $11 6.5 66,375 2,304,682 $11 5.9 38,451
$ 12.00 -$20.49 3,843,898 $18 8.1 38,750 1,036,156 $16 7.6 11,766
$ 20.50 -$29.99 2,606,124 $22 9.3 14,979 99,958 $22 8.5 611
$ 1.00 -$29.99 18,875,722 $12 6.5 $296,229 10,436,970 $ 9 5.2 $198,885
F-18