Logitech 2007 Annual Report Download - page 18
Download and view the complete annual report
Please find page 18 of the 2007 Logitech annual report below. You can navigate through the pages in the report by either clicking on the pages listed below, or by using the keyword search tool below to find specific information within the annual report.-
 1
1 -
2
-
3
-
4
-
5
-
6
-
7
-
 8
8 -
 9
9 -
 10
10 -
 11
11 -
 12
12 -
 13
13 -
 14
14 -
 15
15 -
 16
16 -
 17
17 -
 18
18 -
 19
19 -
 20
20 -
 21
21 -
 22
22 -
 23
23 -
 24
24 -
 25
25 -
 26
26 -
 27
27 -
 28
28 -
29
-
30
-
31
-
32
-
33
-
34
-
35
-
36
-
37
-
38
-
39
-
40
-
41
-
42
-
43
-
44
-
45
-
46
-
47
-
48
-
49
-
50
-
51
-
52
-
53
-
54
-
55
-
56
-
57
-
58
-
59
-
60
-
61
-
62
-
63
-
64
-
65
-
66
-
67
-
68
-
69
-
70
-
71
-
72
-
73
-
74
-
75
-
76
-
77
-
78
-
79
-
80
-
81
-
82
-
83
-
84
-
85
-
86
-
87
-
88
-
89
-
90
-
91
-
92
-
93
-
94
-
95
-
96
-
97
-
98
-
99
-
100
-
101
-
102
-
103
-
104
-
105
-
106
-
107
-
108
-
109
-
110
-
111
-
112
-
113
-
114
-
115
-
116
-
117
-
118
-
119
-
120
-
121
-
122
-
123
-
124
-
125
-
126
-
127
-
128
-
129
-
130
-
131
-
132
-
133
-
134
-
135
-
136
-
137
-
138
-
139
-
140
-
141
-
142
-
143
-
144
-
145
-
146
-
147
-
148
-
149
-
150
-
151
-
152
-
153
-
154
-
155
-
156
-
157
-
158
-
159
-
160
-
161
-
162
-
163
-
164
-
165
-
166
 |
 |

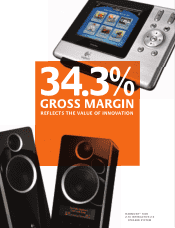
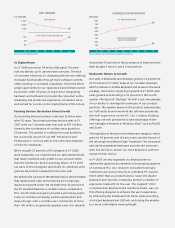
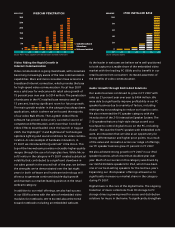
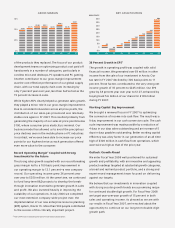
GROSS MARGIN
40%
30%
20%
0%
30.9%
31.7%
33.4% 33.1%
32.2%
34.0%
32.0%
34.3%
NET CASH POSITION
400
350
300
250
200
150
100
50
0
-50
MILLIONS $
40
-46
33
144
184
231
399
FY 00 01 02 03 04 05 06 07 FY 00 01 02 03 04 05 06 07
77
of the products they replaced. The focus of our product
development teams on optimizing product cost paid off
handsomely in a number of categories, particularly in
cordless mice and desktops, PC speakers and PC gaming.
Another contributor to our gross margin improvement
was the cost-effective performance of our global supply
chain, with our total supply chain costs increasing by
only 7 percent year over year, less than half as fast as the
15 percent increase in sales.
While higher ASPs clearly helped us generate sales growth,
they played a minor role in our gross margin improvement.
Due to consistent innovation across all price points, the
distribution of our sales-per-price-band was relatively
stable once again in FY 2007. This resulted primarily from
generating the majority of our sales at price points below
$100, where consumer price elasticity is minimal. Our
business model has allowed us to avoid the precipitous
price declines seen in the mobile phone or PC industries.
In contrast, we’ve even been able to increase our price
points for our high-end mice as each generation offered
even more value to the consumer.
Record Operating Margin* Coupled with Strong
Investments for the Future
The strong sales growth coupled with our record-breaking
gross margin led to a 100 basis point improvement in
our operating margin to 12.1 percent—a new company
record. Our operating income grew 26 percent year
over year to $250 million. At the same time, we continued
to fund long-term R&D projects to develop the break-
through innovation essential to generate growth in sales
and profi t. We also invested heavily in improving the
scalability of our operations. In July 2006 we completed
our most extensive company-wide project ever, the
implementation of our new enterprise resource planning
(ERP) system, Oracle 11i. More than 500 people contributed
to the success of this critically important project.
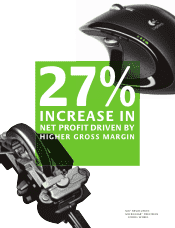
38 Percent Growth in EPS*
The growth in operating profi t was coupled with solid
fi nancial income. We generated over $9 million in other
income from the sale of our investment in Anoto. Our
tax rate in FY 2007 declined by 300 basis points to 11
percent. These factors contributed to the very strong net
income growth of 35 percent to $245 million. Our EPS
grew by 38 percent year over year to $1.27, enhanced by
buying back 5.6 million of our shares for $138 million
during FY 2007.
Working Capital: Big Improvement
We brought a renewed focus in FY 2007 to optimizing
the conversion of income into cash fl ow. The result was a
9 day improvement in our cash conversion cycle. The cash
cycle improvement was made possible by a reduction of
4 days in our days sales outstanding and an increase of 5
days in days payables outstanding. Better working capital
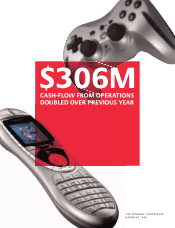
effi ciency was a key factor in our generation of an all time
high of $306 million in cash fl ow from operations, which
was twice as high as that of the prior year.
Outlook: Growth Ahead
We enter Fiscal Year 2008 well positioned for sustained
growth and profi tability, with an innovative and appealing
product roadmap targeted at substantial growth categories,
a broad and resilient product portfolio, and a strong and
experienced management team focused on delivering
against our targets.
We believe that our investments in innovation coupled
with strong secular growth trends are a promising recipe
for continued double-digit growth. For Fiscal Year 2008
we target year-over-year growth of 15 percent in both
sales and operating income. As pleased as we are with
our results in Fiscal Year 2007, we’re excited about the
opportunity to continue on our long-term double-digit
growth path.
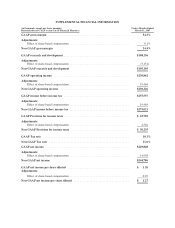
* Non-GAAP measure excluding the cost of share-based compensation