Logitech 2007 Annual Report Download - page 122
Download and view the complete annual report
Please find page 122 of the 2007 Logitech annual report below. You can navigate through the pages in the report by either clicking on the pages listed below, or by using the keyword search tool below to find specific information within the annual report.-
 1
1 -
2
-
3
-
4
-
5
-
6
-
7
-
8
-
9
-
10
-
11
-
12
-
13
-
14
-
15
-
16
-
17
-
18
-
19
-
20
-
21
-
22
-
23
-
24
-
25
-
26
-
27
-
28
-
29
-
30
-
31
-
32
-
33
-
34
-
35
-
36
-
37
-
38
-
39
-
40
-
41
-
42
-
43
-
44
-
45
-
46
-
47
-
48
-
49
-
50
-
51
-
52
-
53
-
54
-
55
-
56
-
57
-
58
-
59
-
60
-
61
-
62
-
63
-
64
-
65
-
66
-
67
-
68
-
69
-
70
-
71
-
72
-
73
-
74
-
75
-
76
-
77
-
78
-
79
-
80
-
81
-
82
-
83
-
84
-
85
-
86
-
87
-
88
-
89
-
90
-
91
-
92
-
93
-
94
-
95
-
96
-
97
-
98
-
99
-
100
-
101
-
102
-
103
-
104
-
105
-
106
-
107
-
108
-
109
-
110
-
111
-
 112
112 -
 113
113 -
 114
114 -
 115
115 -
 116
116 -
 117
117 -
 118
118 -
 119
119 -
 120
120 -
 121
121 -
 122
122 -
 123
123 -
 124
124 -
 125
125 -
 126
126 -
 127
127 -
 128
128 -
 129
129 -
 130
130 -
 131
131 -
 132
132 -
133
-
134
-
135
-
136
-
137
-
138
-
139
-
140
-
141
-
142
-
143
-
144
-
145
-
146
-
147
-
148
-
149
-
150
-
151
-
152
-
153
-
154
-
155
-
156
-
157
-
158
-
159
-
160
-
161
-
162
-
163
-
164
-
165
-
166
 |
 |

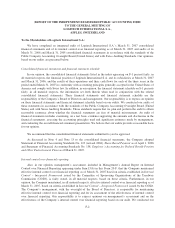
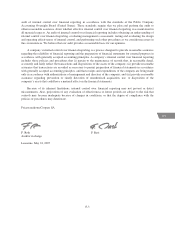
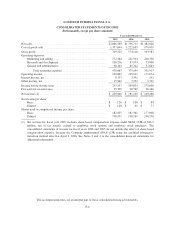
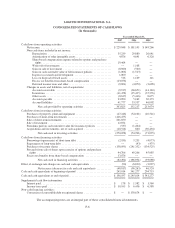
LOGITECH INTERNATIONAL S.A.
CONSOLIDATED STATEMENTS OF INCOME
(In thousands, except per share amounts)
Year ended March 31,
2007 2006 2005
Net sales .................................................. $2,066,569 $1,796,715 $1,482,626
Cost of goods sold ........................................... 1,357,044 1,222,605 979,039
Gross profit ................................................ 709,525 574,110 503,587
Operating expenses:
Marketing and selling .................................... 272,264 221,504 200,350
Research and development ................................ 108,256 87,953 73,900
General and administrative ................................ 98,143 65,742 57,663
Total operating expenses .............................. 478,663 375,199 331,913
Operating income ........................................... 230,862 198,911 171,674
Interest income, net .......................................... 8,733 3,591 141
Other income, net ........................................... 15,962 7,352 3,791
Income before income taxes ................................... 255,557 209,854 175,606
Provision for income taxes .................................... 25,709 28,749 26,340
Net income (1) .............................................. $ 229,848 $ 181,105 $ 149,266
Net income per share:
Basic ................................................. $ 1.26 $ 1.00 $ .84
Diluted ................................................ $ 1.20 $ .92 $ .77
Shares used to compute net income per share:
Basic ................................................. 182,635 181,361 177,008
Diluted ................................................ 190,991 198,769 198,250
(1) Net income for fiscal year 2007 includes share-based compensation expense under SFAS 123R of $14.9
million, net of tax benefit, related to employee stock options and employee stock purchases. The
consolidated statements of income for fiscal years 2006 and 2005 do not include the effect of share-based
compensation expense, because the Company implemented SFAS 123R using the modified prospective
transition method effective April 1, 2006. See Notes 2 and 4 to the consolidated financial statements for
additional information.
The accompanying notes are an integral part of these consolidated financial statements.
F-4