Logitech 2007 Annual Report Download - page 20
Download and view the complete annual report
Please find page 20 of the 2007 Logitech annual report below. You can navigate through the pages in the report by either clicking on the pages listed below, or by using the keyword search tool below to find specific information within the annual report.-
 1
1 -
2
-
3
-
4
-
5
-
6
-
7
-
8
-
9
-
 10
10 -
 11
11 -
 12
12 -
 13
13 -
 14
14 -
 15
15 -
 16
16 -
 17
17 -
 18
18 -
 19
19 -
 20
20 -
 21
21 -
 22
22 -
 23
23 -
 24
24 -
 25
25 -
 26
26 -
 27
27 -
 28
28 -
 29
29 -
 30
30 -
31
-
32
-
33
-
34
-
35
-
36
-
37
-
38
-
39
-
40
-
41
-
42
-
43
-
44
-
45
-
46
-
47
-
48
-
49
-
50
-
51
-
52
-
53
-
54
-
55
-
56
-
57
-
58
-
59
-
60
-
61
-
62
-
63
-
64
-
65
-
66
-
67
-
68
-
69
-
70
-
71
-
72
-
73
-
74
-
75
-
76
-
77
-
78
-
79
-
80
-
81
-
82
-
83
-
84
-
85
-
86
-
87
-
88
-
89
-
90
-
91
-
92
-
93
-
94
-
95
-
96
-
97
-
98
-
99
-
100
-
101
-
102
-
103
-
104
-
105
-
106
-
107
-
108
-
109
-
110
-
111
-
112
-
113
-
114
-
115
-
116
-
117
-
118
-
119
-
120
-
121
-
122
-
123
-
124
-
125
-
126
-
127
-
128
-
129
-
130
-
131
-
132
-
133
-
134
-
135
-
136
-
137
-
138
-
139
-
140
-
141
-
142
-
143
-
144
-
145
-
146
-
147
-
148
-
149
-
150
-
151
-
152
-
153
-
154
-
155
-
156
-
157
-
158
-
159
-
160
-
161
-
162
-
163
-
164
-
165
-
166
 |
 |

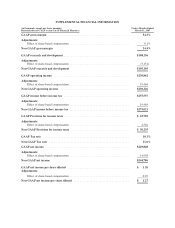
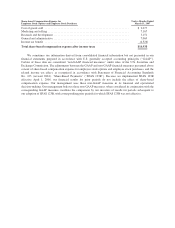
SUPPLEMENTAL FINANCIAL INFORMATION
(in thousands, except per share amounts)
Reconciliation of GAAP to non-GAAP Financial Measures
Twelve Months Ended
March 31, 2007
GAAP gross margin ........................................................ 34.3%
Adjustments:
Effect of share-based compensation ......................................... 0.1%
Non-GAAP gross margin 34.4%
GAAP research and development ............................................. $108,256
Adjustments:
Effect of share-based compensation ......................................... (3,151)
Non-GAAP research and development $105,105
GAAP operating income .................................................... $230,862
Adjustments:
Effect of share-based compensation ......................................... 19,464
Non-GAAP operating income ................................................ $250,326
GAAP income before income tax ............................................. $255,557
Adjustments:
Effect of share-based compensation ......................................... 19,464
Non-GAAP income before income tax ......................................... $275,021
GAAP Provision for income taxes ............................................. $ 25,709
Adjustments:
Effect of share-based compensation ......................................... 4,526
Non-GAAP Provision for income taxes ........................................ $ 30,235
GAAP Tax rate ........................................................... 10.1%
Non-GAAP Tax rate ....................................................... 11.0%
GAAP net income ......................................................... $229,848
Adjustments:
Effect of share-based compensation ......................................... 14,938
Non-GAAP net income $244,786
GAAP net income per share diluted .......................................... $ 1.20
Adjustments:
Effect of share-based compensation ......................................... 0.07
Non-GAAP net income per share diluted ...................................... $ 1.27