Logitech 2007 Annual Report Download - page 124
Download and view the complete annual report
Please find page 124 of the 2007 Logitech annual report below. You can navigate through the pages in the report by either clicking on the pages listed below, or by using the keyword search tool below to find specific information within the annual report.-
 1
1 -
2
-
3
-
4
-
5
-
6
-
7
-
8
-
9
-
10
-
11
-
12
-
13
-
14
-
15
-
16
-
17
-
18
-
19
-
20
-
21
-
22
-
23
-
24
-
25
-
26
-
27
-
28
-
29
-
30
-
31
-
32
-
33
-
34
-
35
-
36
-
37
-
38
-
39
-
40
-
41
-
42
-
43
-
44
-
45
-
46
-
47
-
48
-
49
-
50
-
51
-
52
-
53
-
54
-
55
-
56
-
57
-
58
-
59
-
60
-
61
-
62
-
63
-
64
-
65
-
66
-
67
-
68
-
69
-
70
-
71
-
72
-
73
-
74
-
75
-
76
-
77
-
78
-
79
-
80
-
81
-
82
-
83
-
84
-
85
-
86
-
87
-
88
-
89
-
90
-
91
-
92
-
93
-
94
-
95
-
96
-
97
-
98
-
99
-
100
-
101
-
102
-
103
-
104
-
105
-
106
-
107
-
108
-
109
-
110
-
111
-
112
-
113
-
 114
114 -
 115
115 -
 116
116 -
 117
117 -
 118
118 -
 119
119 -
 120
120 -
 121
121 -
 122
122 -
 123
123 -
 124
124 -
 125
125 -
 126
126 -
 127
127 -
 128
128 -
 129
129 -
 130
130 -
 131
131 -
 132
132 -
 133
133 -
 134
134 -
135
-
136
-
137
-
138
-
139
-
140
-
141
-
142
-
143
-
144
-
145
-
146
-
147
-
148
-
149
-
150
-
151
-
152
-
153
-
154
-
155
-
156
-
157
-
158
-
159
-
160
-
161
-
162
-
163
-
164
-
165
-
166
 |
 |

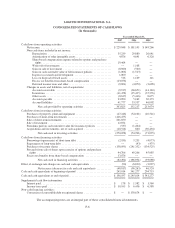
LOGITECH INTERNATIONAL S.A.
CONSOLIDATED STATEMENTS OF CASH FLOWS
(In thousands)
Year ended March 31,
2007 2006 2005
Cash flows from operating activities:
Net income ................................................... $229,848 $ 181,105 $ 149,266
Non-cash items included in net income:
Depreciation .............................................. 35,239 29,880 26,041
Amortization of other intangible assets .......................... 4,876 4,641 6,320
Share-based compensation expense related to options and purchase
rights .................................................. 19,464 — —
Write-off of investments ..................................... — 1,168 —
Gain on sale of investment ................................... (8,980) (560) —
Gain on cash surrender value of life insurance policies ............. (1,006) (1,523) —
In-process research and development ........................... 1,000 — —
Loss on disposal of fixed assets ............................... 516 1,169 111
Excess tax benefits from share-based compensation ............... (13,076) — —
Deferred income taxes and other ............................... (9,691) (4,870) (3,698)
Changes in assets and liabilities, net of acquisitions:
Accounts receivable ........................................ (9,917) (66,651) (14,140)
Inventories ................................................ (11,478) (25,425) (35,276)
Other assets ............................................... (8,637) (5,416) 8,675
Accounts payable .......................................... 33,890 5,162 30,373
Accrued liabilities .......................................... 41,777 33,537 46,002
Net cash provided by operating activities .................... 303,825 152,217 213,674
Cash flows from investing activities:
Purchases of property, plant and equipment .......................... (47,246) (54,102) (40,541)
Purchases of short-term investments ................................ (416,475) — —
Sales of short-term investments ................................... 201,850 — —
Sale of investment .............................................. 12,874 — —
Premiums paid on cash surrender value life insurance policies ........... (537) (1,464) —
Acquisitions and investments, net of cash acquired .................... (20,524) 860 (30,494)
Net cash used in investing activities ........................ (270,058) (54,706) (71,035)
Cash flows from financing activities:
Borrowings (repayments) of short-term debt ......................... (2,181) 5,235 (4,073)
Repayments of long-term debt .................................... — (43) (475)
Purchases of treasury shares ...................................... (138,095) (241,352) (134,525)
Proceeds from sale of shares upon exercise of options and purchase
rights ...................................................... 44,706 49,206 45,985
Excess tax benefits from share-based compensation ................... 13,076 — —
Net cash used in financing activities ........................ (82,494) (186,954) (93,088)
Effect of exchange rate changes on cash and cash equivalents ................ (90) (6,820) (3,027)
Net increase (decrease) in cash and cash equivalents ........... (48,817) (96,263) 46,524
Cash and cash equivalents at beginning of period ......................... 245,014 341,277 294,753
Cash and cash equivalents at end of period ............................... $196,197 $ 245,014 $ 341,277
Supplemental cash flow information:
Interest paid ................................................... $ 178 $ 1,582 $ 1,560
Income taxes paid .............................................. $ 10,165 $ 6,456 $ 6,588
Non-cash financing activities:
Conversion of convertible debt to registered shares .................... $ — $138,674 $ —
The accompanying notes are an integral part of these consolidated financial statements.
F-6