Logitech 2007 Annual Report Download - page 97
Download and view the complete annual report
Please find page 97 of the 2007 Logitech annual report below. You can navigate through the pages in the report by either clicking on the pages listed below, or by using the keyword search tool below to find specific information within the annual report.-
 1
1 -
2
-
3
-
4
-
5
-
6
-
7
-
8
-
9
-
10
-
11
-
12
-
13
-
14
-
15
-
16
-
17
-
18
-
19
-
20
-
21
-
22
-
23
-
24
-
25
-
26
-
27
-
28
-
29
-
30
-
31
-
32
-
33
-
34
-
35
-
36
-
37
-
38
-
39
-
40
-
41
-
42
-
43
-
44
-
45
-
46
-
47
-
48
-
49
-
50
-
51
-
52
-
53
-
54
-
55
-
56
-
57
-
58
-
59
-
60
-
61
-
62
-
63
-
64
-
65
-
66
-
67
-
68
-
69
-
70
-
71
-
72
-
73
-
74
-
75
-
76
-
77
-
78
-
79
-
80
-
81
-
82
-
83
-
84
-
85
-
86
-
 87
87 -
 88
88 -
 89
89 -
 90
90 -
 91
91 -
 92
92 -
 93
93 -
 94
94 -
 95
95 -
 96
96 -
 97
97 -
 98
98 -
 99
99 -
 100
100 -
 101
101 -
 102
102 -
 103
103 -
 104
104 -
 105
105 -
 106
106 -
 107
107 -
108
-
109
-
110
-
111
-
112
-
113
-
114
-
115
-
116
-
117
-
118
-
119
-
120
-
121
-
122
-
123
-
124
-
125
-
126
-
127
-
128
-
129
-
130
-
131
-
132
-
133
-
134
-
135
-
136
-
137
-
138
-
139
-
140
-
141
-
142
-
143
-
144
-
145
-
146
-
147
-
148
-
149
-
150
-
151
-
152
-
153
-
154
-
155
-
156
-
157
-
158
-
159
-
160
-
161
-
162
-
163
-
164
-
165
-
166
 |
 |

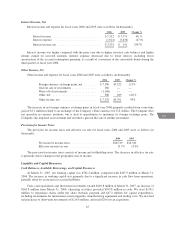
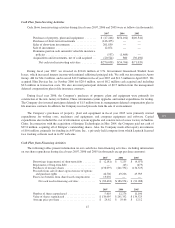
Interest Income, Net
Interest income and expense for fiscal years 2006 and 2005 were as follows (in thousands):
2006 2005 Change %
Interest income .................................. $5,512 $ 3,771 46 %
Interest expense ................................. (1,921) (3,630) (47)%
Interest income, net .............................. $3,591 $ 141 2447%
Interest income was higher compared with the prior year due to higher invested cash balances and higher
returns earned on invested amounts. Interest expense decreased due to lower interest, including lower
amortization of the accreted redemption premium, as a result of conversion of the convertible bonds during the
third quarter of fiscal year 2006.
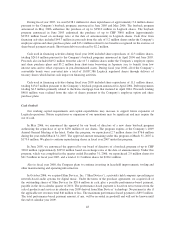
Other Income, Net
Other income and expense for fiscal years 2006 and 2005 were as follows (in thousands):
2006 2005 Change %
Foreign currency exchange gains, net ......... $7,580 $3,522 115%
Gain on sale of investments ................. 560 — —
Write-off of investments ................... (1,168) — —
Other, net ............................... 380 269 (41)%
Other income, net ........................ $7,352 $3,791 94%
The increase in net foreign currency exchange gains in fiscal year 2006 primarily resulted from a one-time
gain of $3.1 million related to an exchange of the Company’s Euro currency for U.S. dollars. The Company does
not speculate in currency positions, but is alert to opportunities to maximize its foreign exchange gains. The
Company also impaired an investment and recorded a gain on the sale of another investment.
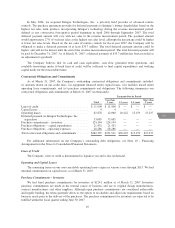
Provision for Income Taxes
The provision for income taxes and effective tax rate for fiscal years 2006 and 2005 were as follows (in
thousands):
2006 2005
Provision for income taxes .......................... $28,749 $26,340
Effective income tax rate ........................... 13.7% 15.0%
The provision for income taxes consists of income and withholding taxes. The decrease in effective tax rate
is primarily due to changes in the geographic mix of income.
Liquidity and Capital Resources
Cash Balances, Available Borrowings, and Capital Resources
At March 31, 2007, net working capital was $542.4 million, compared with $407.9 million at March 31,
2006. The increase in working capital was primarily due to a significant increase in cash flow from operations,
partially offset by an increase in accrued liabilities.
Cash, cash equivalents and short-term investments totaled $410.8 million at March 31, 2007, an increase of
$165.8 million from March 31, 2006. Operating activities provided $303.8 million in cash. We used $138.1
million to repurchase shares under the share buyback program and $47.2 million for capital expenditures,
including investments for information system upgrades, manufacturing equipment and tooling costs. We also had
net purchases of short-term investments of $214.6 million, and used $20.6 for an acquisition.
45
CG