Dollar Tree 2012 Annual Report Download - page 50
Download and view the complete annual report
Please find page 50 of the 2012 Dollar Tree annual report below. You can navigate through the pages in the report by either clicking on the pages listed below, or by using the keyword search tool below to find specific information within the annual report.-
 1
1 -
2
-
3
-
4
-
5
-
6
-
7
-
8
-
9
-
10
-
11
-
12
-
13
-
14
-
15
-
16
-
17
-
18
-
19
-
20
-
21
-
22
-
23
-
24
-
25
-
26
-
27
-
28
-
29
-
30
-
31
-
32
-
33
-
34
-
35
-
36
-
37
-
38
-
39
-
 40
40 -
 41
41 -
 42
42 -
 43
43 -
 44
44 -
 45
45 -
 46
46 -
 47
47 -
 48
48 -
 49
49 -
 50
50 -
 51
51 -
 52
52
 |
 |

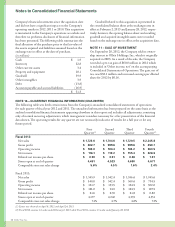
Notes to Consolidated Financial Statements
First
Quarter(1)
Second
Quarter
ird
Quarter
Fourth
Quarter(2)
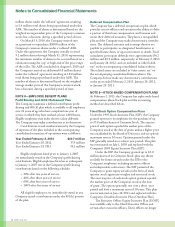
Fiscal 2012:
Netsales $ 1,723.6 $ 1,704.6 $ 1,720.5 $ 2,245.8
Grossprot $ 602.7 $ 599.6 $ 599.6 $ 850.7
Operating income $ 188.0 $ 184.4 $ 184.2 $ 363.5
Netincome $ 116.1 $ 119.2 $ 155.4 $ 228.6
Diluted net income per share $ 0.50 $ 0.51 $ 0.68 $ 1.01
Stores open at end of quarter 4,451 4,523 4,630 4,671
Comparable store net sales change 5.6% 4.5% 1.6% 2.4%
Fiscal2011:
Netsales $ 1,545.9 $ 1,542.4 $ 1,596.6 $ 1,945.6
Grossprot $ 540.8 $ 542.4 $ 560.6 $ 734.5
Operating income $ 161.7 $ 153.5 $ 164.9 $ 302.0
Netincome $ 101.0 $ 94.9 $ 104.5 $ 187.9
Diluted net income per share $ 0.41 $ 0.39 $ 0.43 $ 0.80
Stores open at end of quarter 4,177 4,242 4,335 4,351
Comparable store net sales change 7.1% 4.7% 4.8% 7.3%
(1) Easter was observed on April 8, 2012 and April 24, 2011
(2) Fiscal 2012 contains 14 weeks ended February 2, 2013 while Fiscal 2011 contains 13 weeks ended January 28, 2012
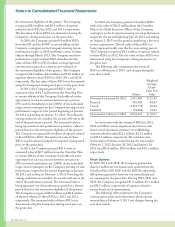
Company’snancialstatementssincetheaquisitiondate
anddidnothaveasignicantimpactontheCompany’s
operatingresultsin2012,2011or2010.isacquisition
isimmaterialtotheCompany’soperationsasawholeand
thereforenoproformadisclosureofnancialinformation
hasbeenpresented.efollowingtablesummarizesthe
nalallocationofthepurchasepricetothefairvalueof
the assets acquired and liabilities assumed based on the
exchangerateineectatthedateofpurchase.
(in millions)
Cash $ 1.9
Inventory 22.8
Other current assets 3.4
Property and equipment 10.1
Goodwill 39.9
Other intangibles 3.9
Debt (13.8)
Ac counts payable and accrued liabilities (16.9)
$ 51.3
Goodwill related to this acquisition is presented in
the consolidated balance sheet at the exchange rates in
eectatFebruary2,2013andJanuary28,2012,respec-
tively; however, the opening balance sheet and resulting
goodwill and acquired intangible assets were recorded
basedontheexchangerateineectattheacquisitiondate.
NOTE 11 – SALE OF INVESTMENT
OnSeptember28,2012,theCompanysolditsowner-
shipinterestinOllie’sHoldings,Inc.,whichitoriginally
acquiredin2003.Asaresultofthesale,theCompany
recordedapre-taxgainof$60.8millionin2012which
is included in “Other income, net” on the accompanying
Consolidated Statements of Operations. e gain, net of
tax,was$38.1millionandincreasedearningsperdiluted
sharefor2012by$0.16.
NOTE 12—QUARTERLY FINANCIAL INFORMATION (UNAUDITED)
efollowingtablesetsforthcertainitemsfromtheCompany’sunauditedconsolidatedstatementsofoperations
foreachquarterofscalyear2012and2011.eunauditedinformationhasbeenpreparedonthesamebasisasthe
auditedconsolidatednancialstatementsappearingelsewhereinthisreportandincludesalladjustments,consisting
onlyofnormalrecurringadjustments,whichmanagementconsidersnecessaryforafairpresentationofthenancial
data shown. e operating results for any quarter are not necessarily indicative of results for a full year or for any
future period.
48 Dollar Tree, Inc.