Dollar Tree 2012 Annual Report Download - page 1
Download and view the complete annual report
Please find page 1 of the 2012 Dollar Tree annual report below. You can navigate through the pages in the report by either clicking on the pages listed below, or by using the keyword search tool below to find specific information within the annual report.-
 1
1 -
 2
2 -
 3
3 -
 4
4 -
 5
5 -
 6
6 -
 7
7 -
 8
8 -
 9
9 -
 10
10 -
 11
11 -
 12
12 -
13
-
14
-
15
-
16
-
17
-
18
-
19
-
20
-
21
-
22
-
23
-
24
-
25
-
26
-
27
-
28
-
29
-
30
-
31
-
32
-
33
-
34
-
35
-
36
-
37
-
38
-
39
-
40
-
41
-
42
-
43
-
44
-
45
-
46
-
47
-
48
-
49
-
50
-
51
-
52
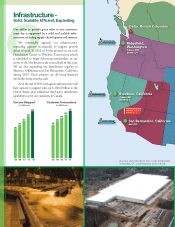
 |
 |
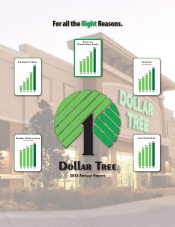
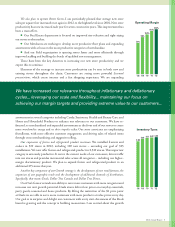
‘08 ‘09 ‘10 ‘11 ‘12
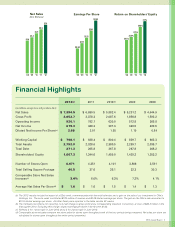
27.5%
34.8%
41.1 %
23.9%
20.5%
Return on
Shareholders’ Equity
‘08 ‘09 ‘10 ‘11 ‘12
10.7%
11.8%12.4%
9.8%
7. 9%
Operating Margin
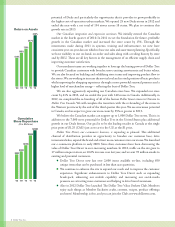
‘08 ‘09 ‘10 ‘11 ‘12
$5.9
$6.6
$7.4
$5.2
$4.6
Net Sales
($ in Billions)
2012 Annual Report
‘08 ‘09 ‘10 ‘11 ‘12
$1.55
$2.01
$2.68
$1.19
$0.84
Earnings Per Share
For all the Right Reasons.
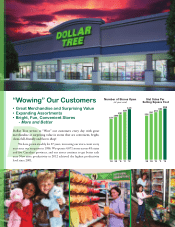
‘08 ‘09 ‘10 ‘11 ‘12
4,101
4,351
4,671
3,806
3,591
Number of Stores Open
(at year-end)