Dollar Tree 2012 Annual Report Download - page 29
Download and view the complete annual report
Please find page 29 of the 2012 Dollar Tree annual report below. You can navigate through the pages in the report by either clicking on the pages listed below, or by using the keyword search tool below to find specific information within the annual report.
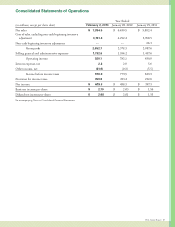
(in millions, except per share data)
YearEnded
February 2, 2013 January28,2012 January29,2011
Netsales $ 7,394.5 $ 6,630.5 $ 5,882.4
Co st of sales, excluding non-cash beginning inventory
adjustment
4,741.8 4,252.2 3,768.5
Non-cashbeginninginventoryadjustment
— — 26.3
Grossprot 2,652.7 2,378.3 2,087.6
Selling, general and administrative expenses 1,732.6 1,596.2 1,457.6
Operating income 920.1 782.1 630.0
Interest expense, net 2.8 2.9 5.6
Other income, net (61.6) (0.3) (5.5)
Income before income taxes 978.9 779.5 629.9
Provision for income taxes 359.6 291.2 232.6
Netincome $ 619.3 $ 488.3 $ 397.3
Basic net income per share $ 2.70 $ 2.03 $ 1.56
Diluted net income per share $ 2.68 $ 2.01 $ 1.55
See accompanying Notes to Consolidated Financial Statements.
Consolidated Statements of Operations
2012AnnualReport27


