Dollar Tree 2012 Annual Report Download - page 33
Download and view the complete annual report
Please find page 33 of the 2012 Dollar Tree annual report below. You can navigate through the pages in the report by either clicking on the pages listed below, or by using the keyword search tool below to find specific information within the annual report.-
 1
1 -
2
-
3
-
4
-
5
-
6
-
7
-
8
-
9
-
10
-
11
-
12
-
13
-
14
-
15
-
16
-
17
-
18
-
19
-
20
-
21
-
22
-
 23
23 -
 24
24 -
 25
25 -
 26
26 -
 27
27 -
 28
28 -
 29
29 -
 30
30 -
 31
31 -
 32
32 -
 33
33 -
 34
34 -
 35
35 -
 36
36 -
 37
37 -
 38
38 -
 39
39 -
 40
40 -
 41
41 -
 42
42 -
 43
43 -
44
-
45
-
46
-
47
-
48
-
49
-
50
-
51
-
52
 |
 |

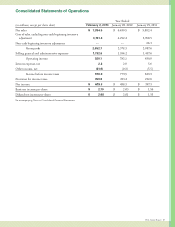
Consolidated Statements of Cash Flows
(in millions)
YearEnded
February 2,
2013
January28,
2012
January29,
2011
Cash flows from operating activities:
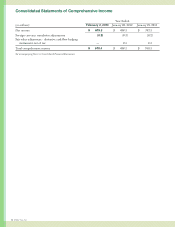
Netincome $ 619.3 $ 488.3 $ 397.3
Adjustmentstoreconcilenetincometonetcash
provided by operating activities:
Depreciationandamortization 175.3 163.9 159.7
GainonsaleofOllie’sinvestment (60.8) — —
Provision for deferred income taxes (7.7) 10.9 (14.4)
Stock-based compensation expense 35.5 31.6 28.3
Non-cashadjustmenttobeginninginventory — — 26.3
Othernon-cashadjustmentstonetincome 4.1 4.4 5.0
C hanges in assets and liabilities increasing
(decreasing)cashandcashequivalents:
Merchandiseinventories (104.0) (64.5) (126.7)
Other assets (56.7) (1.3) 2.0
Accounts payable 59.3 26.9 28.1
Income taxes payable 16.3 (1.1) 15.2
Other current liabilities 20.3 25.4 (9.2)
Other liabilities (23.2) 2.0 7.1
Netcashprovidedbyoperatingactivities 677.7 686.5 518.7
Cash flows from investing activities:
Capital expenditures (312.2) (250.1) (178.7)
Purchase of short-term investments — (6.0) (157.8)
Proceeds from sale of short-term investments — 180.8 10.8
ProceedsfromsaleofOllie’sinvestment 62.3 — —
Purchase of restricted investments (11.0) (16.3) (50.9)
Proceeds from sale of restricted investments — 5.3 52.1
AcquisitionofDollarGiant,netofcashacquiredof$1.9 — — (49.4)
Foreign currency gain/loss (0.4) 0.2 —
Acquisition of favorable lease rights — — (0.2)
Netcashusedininvestingactivities (261.3) (86.1) (374.1)
Cashowsfromnancingactivities:
Principal payments under long-term debt and capital lease obligations (1.5) (2.0) (15.1)
Proceeds from long-term debt 7.0 — —
Payments for share repurchases (340.2) (645.9) (417.1)
Proceeds from stock issued pursuant to stock-based compensation plans 10.0 10.9 20.1
Taxbenetofexercises/vestingofequity-basedcompensation 21.3 13.8 7.8
Netcashusedinnancingactivities (303.4) (623.2) (404.3)
Eectofexchangeratechangesoncashandcashequivalents (1.4) (0.1) (0.7)
Netincrease(decrease)incashandcashequivalents 111.6 (22.9) (260.4)
Cash and cash equivalents at beginning of year 288.3 311.2 571.6
Cash and cash equivalents at end of year $ 399.9 $ 288.3 $ 311.2
Supplemental disclosure of cash flow information:
Cash paid for:
Interest $ 3.3 $ 3.2 $ 6.5
Income taxes $ 333.9 $ 268.3 $ 223.7
See accompanying Notes to Consolidated Financial Statements.
2012AnnualReport31