Dollar Tree 2012 Annual Report Download - page 18
Download and view the complete annual report
Please find page 18 of the 2012 Dollar Tree annual report below. You can navigate through the pages in the report by either clicking on the pages listed below, or by using the keyword search tool below to find specific information within the annual report.-
 1
1 -
2
-
3
-
4
-
5
-
6
-
7
-
 8
8 -
 9
9 -
 10
10 -
 11
11 -
 12
12 -
 13
13 -
 14
14 -
 15
15 -
 16
16 -
 17
17 -
 18
18 -
 19
19 -
 20
20 -
 21
21 -
 22
22 -
 23
23 -
 24
24 -
 25
25 -
 26
26 -
 27
27 -
 28
28 -
29
-
30
-
31
-
32
-
33
-
34
-
35
-
36
-
37
-
38
-
39
-
40
-
41
-
42
-
43
-
44
-
45
-
46
-
47
-
48
-
49
-
50
-
51
-
52
 |
 |

Management’s Discussion & Analysis of
Financial Condition and Results of Operations
Fiscal year ended February 2, 2013 compared to
fiscal year ended January 28, 2012
Net Sales.Netsalesincreased11.5%,or$764.0million,
in2012comparedto2011,resultingfromsalesinour
newstoresandthe53rdweekin2012,whichaccounted
forapproximately$125millionoftheincrease.Oursales
increasewasalsoimpactedbya3.4%increaseincompa-
rable store net sales for the year. is increase is based
ona53-weekcomparisonforbothperiods.Comparable
storenetsalesarepositivelyaectedbyourexpandedand
relocated stores, which we include in the calculation, and,
toalesserextent,arenegativelyaectedwhenweopen
new stores or expand stores near existing ones.
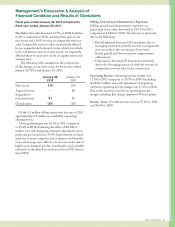
efollowingtablesummarizesthecomponents
ofthechangesinourstorecountforscalyearsended
February2,2013andJanuary28,2012.
February 2,
2013
January28,
2012
Newstores 345 278
Expandedor
relocated stores 87 91
Closed stores (25) (28)
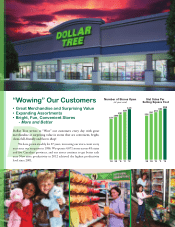
Ofthe345newstoresaddedin2012,25storeswere
openedinJanuary2013.Ofthe2.9millionsellingsquare
footincreasein2012approximately0.3millionwas
added by expanding existing stores.
Grossprotmarginwas35.9%in2012and2011.
Improvement in initial mark-up in many categories and
occupancyanddistributioncostleveragewereosetby
an increase in the mix of higher cost consumer product
merchandiseandhigherfreightcostsinscal2012than
inscal2011.
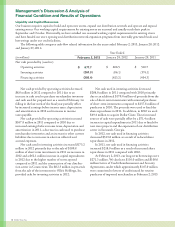
Selling, General and Administrative Expenses.
Selling, general and administrative expenses, as a
percentageofnetsales,decreasedto23.5%for2012
comparedto24.1%for2011.edecreaseisprimarily
due to the following:
•Payrollexpensesdecreased25basispointsdueto
lower incentive compensation achievement.
•Storeoperatingcostsdecreased15basispoints
due to lower utility costs and reduced repairs and
maintenance expenses.
•Operatingandcorporateexpensesdecreased15basis
points due to a favorable legal settlement and lower
debit and credit fees.
•Depreciationdecreased10basispointsprimarily
due to the leveraging associated with the increase in
comparable store net sales in the current year and
salesinthe53rdweekof2012.
Operating Income.Operatingincomemarginwas12.4%
in2012comparedto11.8%in2011.Duetothereasons
notedabove,operatingincomemarginimproved60basis
points.
Other Income, net. Otherincome,netin2012includesa
$60.8milliongainonthesaleofourinvestmentinOllie’s
Holdings, Inc.
Income Taxes.Oureectivetaxratewas36.7%in2012
comparedto37.4%in2011.isdecreaseistheresultof
statute expirations and the settlement of state tax audits.
16 Dollar Tree, Inc.