Dollar Tree 2012 Annual Report Download - page 32
Download and view the complete annual report
Please find page 32 of the 2012 Dollar Tree annual report below. You can navigate through the pages in the report by either clicking on the pages listed below, or by using the keyword search tool below to find specific information within the annual report.-
 1
1 -
2
-
3
-
4
-
5
-
6
-
7
-
8
-
9
-
10
-
11
-
12
-
13
-
14
-
15
-
16
-
17
-
18
-
19
-
20
-
21
-
 22
22 -
 23
23 -
 24
24 -
 25
25 -
 26
26 -
 27
27 -
 28
28 -
 29
29 -
 30
30 -
 31
31 -
 32
32 -
 33
33 -
 34
34 -
 35
35 -
 36
36 -
 37
37 -
 38
38 -
 39
39 -
 40
40 -
 41
41 -
 42
42 -
43
-
44
-
45
-
46
-
47
-
48
-
49
-
50
-
51
-
52
 |
 |

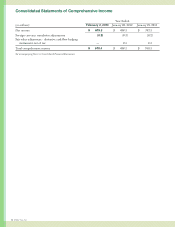
(in millions)
Common
Stock
Shares
Common
Stock
Additional
Paid-in
Capital
Accumulated
Other
Comprehensive
Loss
Retained
Earnings
Shareholders’
Equity
BalanceatJanuary30,2010
262.6 $ 0.9 $— $ (2.4) $ 1,430.7 $1,429.2
Netincome — — — — 397.3 397.3
Total other comprehensive income — — — 2.0 — 2.0
Transfer from additional paid-in capital
for Common Stock dividend — 0.4 (0.4) — — —
Payment for fractional shares resulting
from Common Stock dividend — — (0.3) — — (0.3)
IssuanceofstockunderEmployeeStock
Purchase Plan 0.3 —
4.4 — — 4.4
Exerciseofstockoptions,including
incometaxbenetof$1.9
1.6 — 17.9 — — 17.9
Repurchase and retirement of shares
(18.7) (0.1) (44.8) — (369.8) (414.7)
Stock-based compensation, net, including
incometaxbenetof$5.9 1.0 — 23.2 — — 23.2
BalanceatJanuary29,2011 246.8 1.2 — (0.4) 1,458.2 1,459.0
Netincome — — — — 488.3 488.3
Total other comprehensive loss (0.2) (0.2)
IssuanceofstockunderEmployeeStock
Purchase Plan 0.2 —
4.4 — — 4.4
Exerciseofstockoptions,including
incometaxbenetof$3.0 0.7 — 9.5 — — 9.5
Repurchase and retirement of shares (17.4) (0.1) (43.4) — (602.4) (645.9)
Stock-based compensation, net,
includingtaxbenetof$10.8 0.9 — 29.5 — — 29.5
BalanceatJanuary28,2012 231.2 1.1 — (0.6) 1,344.1 1,344.6
Netincome — — — — 619.3 619.3
Total other comprehensive loss — — — (0.9) — (0.9)
Transfer from additional paid-in capital
for Common Stock dividend — 1.2 (1.2) — — —
IssuanceofstockunderEmployeeStock
Purchase Plan 0.1 —
4.8 — — 4.8
Exerciseofstockoptions,including
incometaxbenetof$7.0 0.6 — 12.8 — — 12.8
Repurchase and retirement of shares (8.1) (0.1) (43.0) — (297.1) (340.2)
Stock-based compensation, net,
includingtaxbenetof$14.3 0.8 — 26.9 — — 26.9
Balance at February 2, 2013 224.6 $ 2.2 $ 0.3 $ (1.5) $ 1,666.3 $ 1,667.3
See accompanying Notes to Consolidated Financial Statements.
Consolidated Statements of Shareholders’ Equity
YearsEndedFebruary2,2013,January28,2012,andJanuary29,2011
— — — —
30 Dollar Tree, Inc.