Dollar Tree 2012 Annual Report Download - page 20
Download and view the complete annual report
Please find page 20 of the 2012 Dollar Tree annual report below. You can navigate through the pages in the report by either clicking on the pages listed below, or by using the keyword search tool below to find specific information within the annual report.-
 1
1 -
2
-
3
-
4
-
5
-
6
-
7
-
8
-
9
-
 10
10 -
 11
11 -
 12
12 -
 13
13 -
 14
14 -
 15
15 -
 16
16 -
 17
17 -
 18
18 -
 19
19 -
 20
20 -
 21
21 -
 22
22 -
 23
23 -
 24
24 -
 25
25 -
 26
26 -
 27
27 -
 28
28 -
 29
29 -
 30
30 -
31
-
32
-
33
-
34
-
35
-
36
-
37
-
38
-
39
-
40
-
41
-
42
-
43
-
44
-
45
-
46
-
47
-
48
-
49
-
50
-
51
-
52
 |
 |

Management’s Discussion & Analysis of
Financial Condition and Results of Operations
Netcashusedininvestingactivitiesdecreased
$288.0millionin2011comparedwith2010primarily
duetoanadditional$170.0millionofproceedsfromthe
sale of short-term investments with minimal purchases
ofshort-terminvestmentscomparedto$157.8millionof
purchasesin2010.eproceedswereusedtofundthe
sharerepurchasesin2011.Inaddition,in2010weused
$49.4milliontoacquireDollarGiant.eseincreased
sourcesofcashwerepartiallyosetbya$71.4million
increaseincapitalexpendituresin2011duetofundsfor
newstoreprojectsandtheexpansionofourdistribution
center in Savannah, Georgia.
In2012,netcashusedinnancingactivities
decreased$319.8millionasaresultofreducedshare
repurchasesin2012.
In2011,netcashusedinnancingactivities
increased$218.9millionasaresultofincreasedshare
repurchasesin2011comparedwith2010.
AtFebruary2,2013,ourlong-termborrowingswere
$271.3million.Wealsohave$110.0millionand$100.0
million Letter of Credit Reimbursement and Security
Agreements,underwhichapproximately$147.0million
were committed to letters of credit issued for routine
purchasesofimportedmerchandiseatFebruary2,2013.
Netcashprovidedbyoperatingactivitiesdecreased
$8.8millionin2012comparedto2011duetoan
increase in cash used to purchase merchandise inventory
and cash used for prepaid rent as a result of February 1st
fallinginthelastweekofthescalyearpartiallyoset
by increased earnings before income taxes, depreciation
andamortizationin2012andincreasesinincome
taxes payable.
Netcashprovidedbyoperatingactivitiesincreased
$167.8millionin2011comparedto2010dueto
increased earnings before income taxes, depreciation and
amortizationin2011,adecreaseincashusedtopurchase
merchandise inventories and an increase in other current
liabilities due to increases in sales tax collected and
accrued expenses.
Netcashusedininvestingactivitiesincreased$175.2
millionin2012primarilyduetothesaleof$180.8
millionofshort-terminvestmentsin2011versusnonein
2012anda$62.1millionincreaseincapitalexpenditures
in2012duetothehighernumberofstoresopened
comparedto2011andtheconstructionofourdistribu-
tioncenterinConnecticut.e$62.3millioninproceeds
fromthesaleoftheinvestmentinOllie’sHoldings,Inc.
providedcashforinvestingactivitiesin2012.
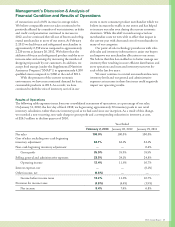
Liquidity and Capital Resources
Our business requires capital to build and open new stores, expand our distribution network and operate and expand
existing stores. Our working capital requirements for existing stores are seasonal and usually reach their peak in
SeptemberandOctober.Historically,wehavesatisedourseasonalworkingcapitalrequirementsforexistingstores
and have funded our store opening and distribution network expansion programs from internally generated funds and
borrowings under our credit facilities.
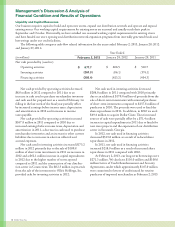
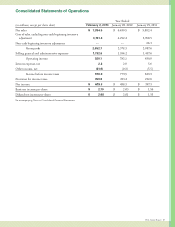
efollowingtablecomparescash-owrelatedinformationfortheyearsendedFebruary2,2013,January28,2012
andJanuary29,2011:
YearEnded
(in millions) February 2, 2013 January28,2012 January29,2011
Netcashprovidedby(usedin):
Operating activities $ 677.7 $ 686.5 $ 518.7
Investing activities (261.3) (86.1) (374.1)
Financing activities (303.4) (623.2) (404.3)
18 Dollar Tree, Inc.