Dollar Tree 2012 Annual Report Download - page 17
Download and view the complete annual report
Please find page 17 of the 2012 Dollar Tree annual report below. You can navigate through the pages in the report by either clicking on the pages listed below, or by using the keyword search tool below to find specific information within the annual report.-
 1
1 -
2
-
3
-
4
-
5
-
6
-
 7
7 -
 8
8 -
 9
9 -
 10
10 -
 11
11 -
 12
12 -
 13
13 -
 14
14 -
 15
15 -
 16
16 -
 17
17 -
 18
18 -
 19
19 -
 20
20 -
 21
21 -
 22
22 -
 23
23 -
 24
24 -
 25
25 -
 26
26 -
 27
27 -
28
-
29
-
30
-
31
-
32
-
33
-
34
-
35
-
36
-
37
-
38
-
39
-
40
-
41
-
42
-
43
-
44
-
45
-
46
-
47
-
48
-
49
-
50
-
51
-
52
 |
 |

stores to more consumer product merchandise which we
believe increases the traffic in our stores and has helped
to increase our sales even during the current economic
downturn.Whilethisshiftinmixhasimpactedour
merchandisecostswewereabletoosetthatimpactin
the current year with decreased costs for merchandise in
many of our categories.
Our point-of-sale technology provides us with valu-
able sales and inventory information to assist our buyers
and improve our merchandise allocation to our stores.
Webelievethatthishasenabledustobettermanageour
inventory flow resulting in more efficient distribution and
store operations and increased inventory turnover for
eachofthelastveyears.
Wemustcontinuetocontrolourmerchandisecosts,
inventory levels and our general and administrative
expenses as increases in these line items could negatively
impact our operating results.
Management’s Discussion & Analysis of
Financial Condition and Results of Operations
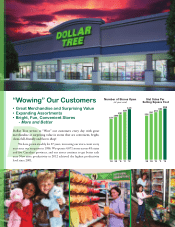
oftransactionsanda0.6%increaseinaverageticket.
Webelievecomparablestorenetsalescontinuedtobe
positivelyaectedbyanumberofourinitiatives,asdebit
and credit card penetration continued to increase in
2012,andwecontinuedtheroll-outoffrozenandrefrig-
erated merchandise to more of our stores. At February
2,2013wehadfrozenandrefrigeratedmerchandisein
approximately2,550storescomparedtoapproximately
2,220storesatJanuary28,2012.Webelievethatthe
additionoffrozenandrefrigeratedproductenablesusto
increase sales and earnings by increasing the number of
shopping trips made by our customers. In addition, we
acceptfoodstamps(undertheSupplementalNutrition
AssistanceProgram(“SNAP”))inapproximately4,200
qualiedstorescomparedto3,860attheendof2011.
Withthepressuresofthecurrenteconomic
environment, we have seen continued demand for basic,
consumableproductsin2012.Asaresult,wehave
continued to shift the mix of inventory carried in our
Results of Operations
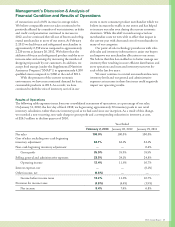
e following table expresses items from our consolidated statements of operations, as a percentage of net sales.
OnJanuary31,2010,therstdayofscal2010,webeganusingapproximately30inventorypoolsinourretail
inventory calculation, rather than one inventory pool as we had used since our inception. As a result of this change,
werecordedanon-recurring,non-cashchargetogrossprotandacorrespondingreductionininventory,atcost,
of$26.3millionintherstquarterof2010.
YearEnded
February 2, 2013 January28,2012 January29,2011
Netsales 100.0% 100.0% 100.0%
Cost of sales, excluding non-cash beginning
inventoryadjustment 64.1% 64.1% 64.1%
Non-cashbeginninginventoryadjustment — — 0.4%
Grossprot 35.9% 35.9% 35.5%
Selling, general and administrative expenses 23.5% 24.1% 24.8%
Operating income 12.4% 11.8% 10.7%
Interest expense, net — — (0.1%)
Other income, net (0.8%) — —
Income before income taxes 13.2% 11.8% 10.7%
Provision for income taxes (4.8%) (4.4%) (3.9%)
Netincome 8.4% 7.4% 6.8%
2012AnnualReport15