Dollar Tree 2012 Annual Report Download - page 16
Download and view the complete annual report
Please find page 16 of the 2012 Dollar Tree annual report below. You can navigate through the pages in the report by either clicking on the pages listed below, or by using the keyword search tool below to find specific information within the annual report.-
 1
1 -
2
-
3
-
4
-
5
-
 6
6 -
 7
7 -
 8
8 -
 9
9 -
 10
10 -
 11
11 -
 12
12 -
 13
13 -
 14
14 -
 15
15 -
 16
16 -
 17
17 -
 18
18 -
 19
19 -
 20
20 -
 21
21 -
 22
22 -
 23
23 -
 24
24 -
 25
25 -
 26
26 -
27
-
28
-
29
-
30
-
31
-
32
-
33
-
34
-
35
-
36
-
37
-
38
-
39
-
40
-
41
-
42
-
43
-
44
-
45
-
46
-
47
-
48
-
49
-
50
-
51
-
52
 |
 |

Management’s Discussion & Analysis of
Financial Condition and Results of Operations
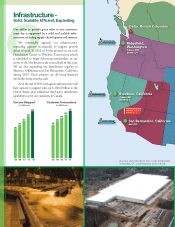
•OnNovember2,2009,wepurchasedanewdistribu-
tion center in San Bernardino, California. is new
distribution center replaced our Salt Lake City, Utah
leasedfacilitywhoseleaseendedinApril2010.
Overview
Our net sales are derived from the sale of merchandise.
Twomajorfactorstendtoaectournetsalestrends.
First is our success at opening new stores or adding new
stores through acquisitions. Second, sales vary at our
existingstoresfromoneyeartothenext.Werefertothis
change as a change in comparable store net sales, because
we compare only those stores that are open throughout
bothoftheperiodsbeingcompared.Weincludesales
from stores expanded during the year in the calculation
ofcomparablestorenetsales,whichhastheeectof
increasing our comparable store net sales. e term
‘expanded’alsoincludesstoresthatarerelocated.
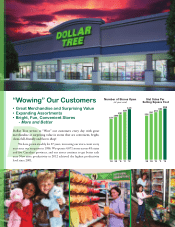
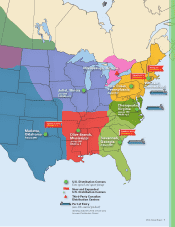
AtFebruary2,2013,weoperated4,671storesin
48statesandtheDistrictofColumbia,aswellasthe
Canadian provinces of British Columbia, Ontario,
Alberta,SaskatchewanandManitoba,with40.5million
sellingsquarefeetcomparedto4,351storeswith37.6
millionsellingsquarefeetatJanuary28,2012.During
scal2012,weopened345stores,expanded87storesand
closed25stores,comparedto278newstoresopened,91
storesexpandedand28storesclosedduringscal2011.
In the current year we increased our selling square footage
by7.7%.Ofthe345storesopenedinscal2012,25were
openedinJanuaryandvewereexpandedinJanuary
2013.Excludingthesestores,oursellingsquarefootage
increasedby7.1%.Ofthe2.9millionsellingsquarefoot
increasein2012,0.3millionwasaddedbyexpanding
existingstores.eaveragesizeofourstoresopenedin
2012wasapproximately8,060sellingsquarefeet(or
about9,900grosssquarefeet).For2013,wecontinueto
plantoopenstoresthatareapproximately8,000-10,000
sellingsquarefeet(orabout10,000-12,000grosssquare
feet).Webelievethatthisstoresizeisouroptimalsize
operationallyandthatthissizealsogivesourcustomers
an ideal shopping environment that invites them to shop
longer and buy more.
Fiscal2012endedonFebruary2,2013andincluded
53weeks,commensuratewiththeretailcalendar.e
53rdweekin2012addedapproximately$125million
insales.Fiscal2011andFiscal2010whichendedon
January28,2012,andJanuary29,2011,respectively,each
included52weeks.
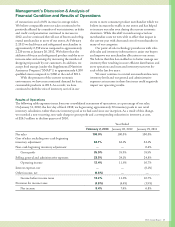
Inscal2012,comparablestorenetsalesincreased
by3.4%.isincreasewasbasedonthecomparable
53weeksforbothyears.ecomparablestorenetsales
increasewastheresultofa2.8%increaseinthenumber
Key Events and Recent Developments
Several key events have had or are expected to have a
signicanteectonouroperations.Youshouldkeepin
mind that:
•InJuly2012,webeganconstructiononanew1.0
millionsquarefootdistributioncenterinWindsor,
Connecticut.Weexpecttobeginshippingproduct
fromthisbuildingin2013.
•OnJune6,2012,weenteredintoave-year
$750.0millionunsecuredCreditAgreement
(theAgreement).eAgreementprovidesfora
$750.0millionrevolvinglineofcredit,includingup
to$150.0millioninavailablelettersofcredit.e
interest rate on the facility is based, at our option,
on a LIBOR rate, plus a margin, or an alternate base
rate,plusamargin.OurFebruary2008,$550.0
million Credit Agreement was terminated concur-
rent with entering into this Agreement.
•OnOctober7,2011,ourBoardofDirectors
authorizedtherepurchaseofanadditional$1.5
billionofourcommonstock.AtFebruary2,2013,
wehad$859.8millionremainingunderBoard
authorizations.
•OnOctober7,2011,wecompleteda410,000
square foot expansion of our distribution center
in Savannah, Georgia. e Savannah distribution
centerisnowa1,014,000squarefoot,fullyauto-
mated facility.
•OnNovember15,2010,wecompletedour
acquisitionof86DollarGiantstores,locatedinthe
Canadian provinces of British Columbia, Ontario,
Alberta and Saskatchewan and we have since opened
storesinManitoba.esestoresoerawideassort-
ment of quality general merchandise, contemporary
seasonal goods and everyday consumables, all priced
at$1.25(CAD)orless.isisourrstexpansionof
retail operations outside of the United States.
•Weassigncosttostoreinventoriesusingtheretail
inventory method, determined on a weighted average
costbasis.Fromourinceptionandthroughscal
2009,weusedoneinventorypoolforthiscalcula-
tion. Because of our investments over the years in our
retailtechnologysystems,wewereabletoreneour
estimate of inventory cost under the retail method
andonJanuary31,2010,therstdayofscal2010,
webeganusingapproximately30inventorypools
in our retail inventory calculation. As a result of
this change, we recorded a non-recurring, non-cash
chargetogrossprotandacorrespondingreduction
ininventory,atcost,of$26.3millionintherst
quarterof2010.iswasaprospectivechangeand
didnothaveanyeectonpriorperiods.
14 Dollar Tree, Inc.