Cincinnati Bell 2009 Annual Report Download - page 97
Download and view the complete annual report
Please find page 97 of the 2009 Cincinnati Bell annual report below. You can navigate through the pages in the report by either clicking on the pages listed below, or by using the keyword search tool below to find specific information within the annual report.-
 1
1 -
2
-
3
-
4
-
5
-
6
-
7
-
8
-
9
-
10
-
11
-
12
-
13
-
14
-
15
-
16
-
17
-
18
-
19
-
20
-
21
-
22
-
23
-
24
-
25
-
26
-
27
-
28
-
29
-
30
-
31
-
32
-
33
-
34
-
35
-
36
-
37
-
38
-
39
-
40
-
41
-
42
-
43
-
44
-
45
-
46
-
47
-
48
-
49
-
50
-
51
-
52
-
53
-
54
-
55
-
56
-
57
-
58
-
59
-
60
-
61
-
62
-
63
-
64
-
65
-
66
-
67
-
68
-
69
-
70
-
71
-
72
-
73
-
74
-
75
-
76
-
77
-
78
-
79
-
80
-
81
-
82
-
83
-
84
-
85
-
86
-
 87
87 -
 88
88 -
 89
89 -
 90
90 -
 91
91 -
 92
92 -
 93
93 -
 94
94 -
 95
95 -
 96
96 -
 97
97 -
 98
98 -
 99
99 -
 100
100 -
 101
101 -
 102
102 -
 103
103 -
 104
104 -
 105
105 -
 106
106 -
 107
107 -
108
-
109
-
110
-
111
-
112
-
113
-
114
-
115
-
116
-
117
-
118
-
119
-
120
-
121
-
122
-
123
-
124
-
125
-
126
-
127
-
128
-
129
-
130
-
131
-
132
-
133
-
134
-
135
-
136
-
137
-
138
-
139
-
140
-
141
-
142
-
143
-
144
-
145
-
146
-
147
-
148
-
149
-
150
-
151
-
152
-
153
-
154
-
155
-
156
-
157
-
158
-
159
-
160
-
161
-
162
-
163
-
164
-
165
-
166
-
167
-
168
-
169
-
170
-
171
-
172
-
173
-
174
-
175
-
176
-
177
-
178
-
179
-
180
-
181
-
182
-
183
-
184
-
185
-
186
-
187
-
188
 |
 |

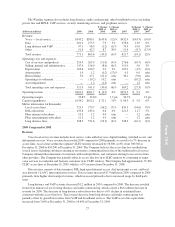
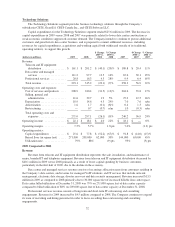
The Wireline segment also includes long distance, audio conferencing, other broadband services including
private line and MPLS, VoIP services, security monitoring services, and payphone services.
(dollars in millions) 2009 2008
$ Change
2009 vs.
2008
% Change
2009 vs.
2008 2007
$ Change
2008 vs.
2007
% Change
2008 vs.
2007
Revenue:
Voice — local service ................ $343.2 $389.1 $(45.9) (12)% $432.4 $(43.3) (10)%
Data .............................. 281.4 273.5 7.9 3% 258.6 14.9 6%
Long distance and VoIP .............. 97.1 98.3 (1.2) (1)% 79.3 19.0 24%
Other ............................. 51.4 42.7 8.7 20% 51.4 (8.7) (17)%
Total revenue ....................... 773.1 803.6 (30.5) (4)% 821.7 (18.1) (2)%
Operating costs and expenses:
Cost of services and products .......... 254.9 265.9 (11.0) (4)% 276.6 (10.7) (4)%
Selling, general and administrative ...... 147.4 156.0 (8.6) (6)% 151.0 5.0 3%
Depreciation ....................... 103.6 100.7 2.9 3% 105.2 (4.5) (4)%
Amortization ....................... 1.0 1.2 (0.2) (17)% 0.3 0.9 n/m
Restructuring ....................... 5.0 27.1 (22.1) n/m 36.1 (9.0) n/m
Operating tax settlement .............. — (10.2) 10.2 n/m — (10.2) n/m
Asset impairment ................... — 1.2 (1.2) n/m — 1.2 n/m
Total operating costs and expenses ...... 511.9 541.9 (30.0) (6)% 569.2 (27.3) (5)%
Operating income ..................... $261.2 $261.7 $ (0.5) 0% $252.5 $ 9.2 4%
Operating margin ..................... 33.8% 32.6% 1.2 pts 30.7% 1.9 pts
Capital expenditures ................... $134.2 $102.1 $ 32.1 31% $ 96.3 $ 5.8 6%
Metric information (in thousands):
Local access lines ................... 723.5 779.7 (56.2) (7)% 834.3 (54.6) (7)%
DSL subscribers .................... 233.8 233.2 0.6 0% 221.5 11.7 5%
Fiber internet subscribers ............. 10.2 1.2 9.0 n/m — 1.2 n/m
Fiber entertainment subscribers ........ 11.1 1.2 9.9 n/m — 1.2 n/m
Long distance lines .................. 508.3 531.6 (23.3) (4)% 548.3 (16.7) (3)%
2009 Compared to 2008
Revenue
Voice local service revenue includes local service, value added services, digital trunking, switched access, and
information services. Voice revenue decreased in 2009 compared to 2008 primarily as a result of a 7% decrease in
access lines. Access lines within the segment’s ILEC territory decreased by 58,300, or 8%, from 708,500 at
December 31, 2008 to 650,200 at December 31, 2009. The Company believes the access line loss resulted from
several factors including customers electing to use wireless communication in lieu of the traditional local service,
Company-initiated disconnections of customers with credit problems, and customers electing to use service from
other providers. The Company has partially offset its access line loss in its ILEC territory by continuing to target
voice services to residential and business customers in its CLEC territory. The Company had approximately 73,300
CLEC access lines at December 31, 2009, which is a 3% increase from December 31, 2008.
Data revenue consists of data transport, DSL high-speed internet access, dial-up internet access, and local
area network (“LAN”) interconnection services. Data revenue increased $7.9 million in 2009 compared to 2008
primarily from higher data transport revenue, which increased primarily due to increased usage by third party
users.
Long distance and VoIP revenue decreased $1.2 million in 2009 compared to 2008. The decrease resulted
from lower minutes of use for long distance and audio conferencing, which caused a $6.6 million decrease in
revenue for 2009. The decrease in long distance subscribers was due to a 6% decline in residential lines,
consistent with the access line loss. The revenue decrease from long distance and audio conferencing was
partially offset by growth in revenue from VoIP and broadband services. The VoIP access line equivalents
increased from 7,600 at December 31, 2008 to 14,600 at December 31, 2009.
27
Form 10-K