Cincinnati Bell 2009 Annual Report Download - page 103
Download and view the complete annual report
Please find page 103 of the 2009 Cincinnati Bell annual report below. You can navigate through the pages in the report by either clicking on the pages listed below, or by using the keyword search tool below to find specific information within the annual report.-
 1
1 -
2
-
3
-
4
-
5
-
6
-
7
-
8
-
9
-
10
-
11
-
12
-
13
-
14
-
15
-
16
-
17
-
18
-
19
-
20
-
21
-
22
-
23
-
24
-
25
-
26
-
27
-
28
-
29
-
30
-
31
-
32
-
33
-
34
-
35
-
36
-
37
-
38
-
39
-
40
-
41
-
42
-
43
-
44
-
45
-
46
-
47
-
48
-
49
-
50
-
51
-
52
-
53
-
54
-
55
-
56
-
57
-
58
-
59
-
60
-
61
-
62
-
63
-
64
-
65
-
66
-
67
-
68
-
69
-
70
-
71
-
72
-
73
-
74
-
75
-
76
-
77
-
78
-
79
-
80
-
81
-
82
-
83
-
84
-
85
-
86
-
87
-
88
-
89
-
90
-
91
-
92
-
 93
93 -
 94
94 -
 95
95 -
 96
96 -
 97
97 -
 98
98 -
 99
99 -
 100
100 -
 101
101 -
 102
102 -
 103
103 -
 104
104 -
 105
105 -
 106
106 -
 107
107 -
 108
108 -
 109
109 -
 110
110 -
 111
111 -
 112
112 -
 113
113 -
114
-
115
-
116
-
117
-
118
-
119
-
120
-
121
-
122
-
123
-
124
-
125
-
126
-
127
-
128
-
129
-
130
-
131
-
132
-
133
-
134
-
135
-
136
-
137
-
138
-
139
-
140
-
141
-
142
-
143
-
144
-
145
-
146
-
147
-
148
-
149
-
150
-
151
-
152
-
153
-
154
-
155
-
156
-
157
-
158
-
159
-
160
-
161
-
162
-
163
-
164
-
165
-
166
-
167
-
168
-
169
-
170
-
171
-
172
-
173
-
174
-
175
-
176
-
177
-
178
-
179
-
180
-
181
-
182
-
183
-
184
-
185
-
186
-
187
-
188
 |
 |

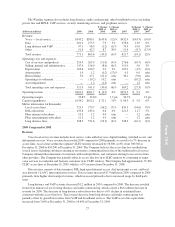
Costs and Expenses
Cost of services and products decreased by $31.5 million in 2009 compared to 2008 primarily due to a $34.7
million decrease in cost of goods sold related to lower telecom and equipment distribution revenue partially
offset by higher data center facility costs and higher payroll related costs to support the growth in both data
center and managed services and professional services revenues.
Selling, general and administrative increased by $1.9 million in 2009 compared to 2008. The increase in
2009 was primarily due to an increase of $3.7 million in payroll and employee related costs to support the
growing operations and an advertising increase of $0.5 million partially offset by lower incentive compensation
costs.
The increase in depreciation expense for 2009 compared to 2008 was primarily due to capital expenditures
in recent years associated with expanding data center capacity.
2008 Compared to 2007
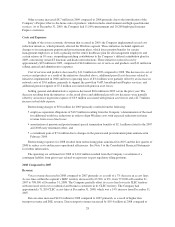
Revenue
Revenue from telecom and IT equipment distribution increased by $20.4 million in 2008 versus 2007
primarily as a result of increased equipment sales of $21.7 million partially offset by lower installation and
maintenance services.
Data center and managed services increased $30.1 million in 2008 as compared to 2007 primarily due to
increased product penetration within managed services and increased billable data center space. Data center
billed utilization at December 31, 2008 was 88% on 209,000 square feet of data center capacity compared to
billed utilization of 93% on 144,000 square feet of data center capacity at December 31, 2007.
Professional services revenue for 2008 increased by $6.4 million compared to 2007. The Company has
expanded its team of recruiting and hiring personnel in order to focus on selling these outsourcing and consulting
engagements.
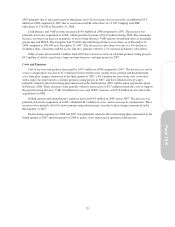
Costs and Expenses
Cost of services and products increased by $35.8 million in 2008 compared to 2007. The increase in 2008
primarily resulted from a $19.0 million increase in the cost of goods sold related to higher telecom and IT
equipment distribution revenue, $12.8 million increase in payroll costs due to growth in data center and managed
services revenue and professional services revenue, increased data center facilities costs and the acquisition of
GramTel.
Selling, general and administrative increased by $12.5 million in 2008 compared to 2007. The increase in
2008 was primarily due to an $8.8 million increase in labor and employee related costs to support the growing
operations of CBTS and the acquisition of GramTel and higher operating taxes, bad debt expense, and
advertising costs.
The increase in depreciation expense for 2008 compared to 2007 was primarily due to capital expenditures
in recent years associated with expanding data center capacity.
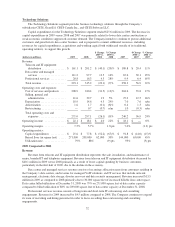
Corporate
Corporate is comprised primarily of general and administrative costs that have not been allocated to the
business segments. Corporate costs totaled $20.8 million in 2009, $21.4 million in 2008, and $22.5 million in
2007.
2009 Compared to 2008
The decrease in corporate costs of $0.6 million from 2008 is due to lower consulting costs of $3.3 million,
lower compensation and other benefits of $3.0 million, a decrease due to a patent lawsuit settlement charge of
$2.0 million in 2008, and lower operating taxes. These cost decreases were offset by a stock-based compensation
increase of $8.5 million, of which $7.7 million is due to the mark-to-market of cash-payment compensation plans
that are indexed to the change in the Company’s stock price, which increased by 79% in 2009.
33
Form 10-K