Cincinnati Bell 2009 Annual Report Download - page 116
Download and view the complete annual report
Please find page 116 of the 2009 Cincinnati Bell annual report below. You can navigate through the pages in the report by either clicking on the pages listed below, or by using the keyword search tool below to find specific information within the annual report.-
 1
1 -
2
-
3
-
4
-
5
-
6
-
7
-
8
-
9
-
10
-
11
-
12
-
13
-
14
-
15
-
16
-
17
-
18
-
19
-
20
-
21
-
22
-
23
-
24
-
25
-
26
-
27
-
28
-
29
-
30
-
31
-
32
-
33
-
34
-
35
-
36
-
37
-
38
-
39
-
40
-
41
-
42
-
43
-
44
-
45
-
46
-
47
-
48
-
49
-
50
-
51
-
52
-
53
-
54
-
55
-
56
-
57
-
58
-
59
-
60
-
61
-
62
-
63
-
64
-
65
-
66
-
67
-
68
-
69
-
70
-
71
-
72
-
73
-
74
-
75
-
76
-
77
-
78
-
79
-
80
-
81
-
82
-
83
-
84
-
85
-
86
-
87
-
88
-
89
-
90
-
91
-
92
-
93
-
94
-
95
-
96
-
97
-
98
-
99
-
100
-
101
-
102
-
103
-
104
-
105
-
 106
106 -
 107
107 -
 108
108 -
 109
109 -
 110
110 -
 111
111 -
 112
112 -
 113
113 -
 114
114 -
 115
115 -
 116
116 -
 117
117 -
 118
118 -
 119
119 -
 120
120 -
 121
121 -
 122
122 -
 123
123 -
 124
124 -
 125
125 -
 126
126 -
127
-
128
-
129
-
130
-
131
-
132
-
133
-
134
-
135
-
136
-
137
-
138
-
139
-
140
-
141
-
142
-
143
-
144
-
145
-
146
-
147
-
148
-
149
-
150
-
151
-
152
-
153
-
154
-
155
-
156
-
157
-
158
-
159
-
160
-
161
-
162
-
163
-
164
-
165
-
166
-
167
-
168
-
169
-
170
-
171
-
172
-
173
-
174
-
175
-
176
-
177
-
178
-
179
-
180
-
181
-
182
-
183
-
184
-
185
-
186
-
187
-
188
 |
 |

invested assets, were a gain of 15% in 2009 and 7% in 2007, and a loss of 23% in 2008. In its pension
calculations, the Company utilizes the market-related value of plan assets, which is a calculated asset value that
recognizes changes in asset fair values in a systematic and consistent manner. Differences between actual and
expected returns are recognized in the market-related value of plan assets over five years.
Health care cost trend
The Company’s health care cost trend rate is developed on historical cost data, the near-term outlook, and an
assessment of likely long-term trends. The health care cost trend rate used to measure the postretirement health
benefit obligation at December 31, 2009 was 9.0% and is assumed to decrease gradually to 4.5% by the year
2015.
The actuarial assumptions used may differ materially from actual results due to the changing market and
economic conditions and other changes. Revisions to and variations from these estimates would impact assets,
liabilities, equity, cash flow, costs of services and products, and selling, general and administrative expenses.
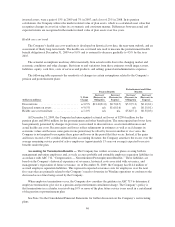
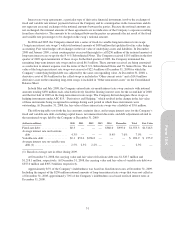
The following table represents the sensitivity of changes in certain assumptions related to the Company’s
pension and postretirement plans:
(dollars in millions)
% Point
Change
Pension Benefits
Postretirement and Other
Benefits
Increase/
(Decrease) in
Obligation
Increase/
(Decrease) in
Expense
Increase/
(Decrease) in
Obligation
Increase/
(Decrease) in
Expense
Discount rate ........................... +/-0.5% $21.0/(21.0) $0.7/(0.7) $5.7/(5.3) $0.1/(0.1)
Expected return on assets .................. +/-0.5% n/a $1.6/(1.6) n/a $0.1/(0.1)
Health care cost trend rate ................. +/-1.0% n/a n/a $5.6/(5.1) $0.3/(0.3)
At December 31, 2009, the Company had unrecognized actuarial net losses of $230.6 million for the
pension plans and $89.6 million for the postretirement and other benefit plans. The unrecognized net losses have
been primarily generated by changes in previous years related to discount rates, asset return differences and
actual health care costs. Because gains and losses reflect refinements in estimates as well as real changes in
economic values and because some gains in one period may be offset by losses in another or vice versa, the
Company is not required to recognize these gains and losses in the period that they occur. Instead, if the gains
and losses exceed a 10% corridor defined in the accounting literature, the Company amortizes the excess over the
average remaining service period of active employees (approximately 15 years on average) expected to receive
benefits under the plan.
Accounting for Termination Benefits — The Company has written severance plans covering both its
management and union employees and, as such, accrues probable and estimable employee separation liabilities in
accordance with ASC 712, “Compensation — Nonretirement Postemployment Benefits.” These liabilities are
based on the Company’s historical experience of severance, historical costs associated with severance, and
management’s expectation of future severance. As of December 31, 2009, the Company has $14.4 million of
accrued employee separation liabilities. This represents expected severance costs for employees over the next
five years that are primarily related to the Company’s need to downsize its Wireline operations to conform to the
decreased access lines being served by the Company.
When employee terminations occur, the Company also considers the guidance in ASC 715 to determine if
employee terminations give rise to a pension and postretirement curtailment charge. The Company’s policy is
that terminations in a calendar year involving 10% or more of the plan future service years result in a curtailment
of the pension or postretirement plan.
See Note 3 to the Consolidated Financial Statements for further discussion on the Company’s restructuring
plans.
46