Cincinnati Bell 2009 Annual Report Download - page 161
Download and view the complete annual report
Please find page 161 of the 2009 Cincinnati Bell annual report below. You can navigate through the pages in the report by either clicking on the pages listed below, or by using the keyword search tool below to find specific information within the annual report.-
 1
1 -
2
-
3
-
4
-
5
-
6
-
7
-
8
-
9
-
10
-
11
-
12
-
13
-
14
-
15
-
16
-
17
-
18
-
19
-
20
-
21
-
22
-
23
-
24
-
25
-
26
-
27
-
28
-
29
-
30
-
31
-
32
-
33
-
34
-
35
-
36
-
37
-
38
-
39
-
40
-
41
-
42
-
43
-
44
-
45
-
46
-
47
-
48
-
49
-
50
-
51
-
52
-
53
-
54
-
55
-
56
-
57
-
58
-
59
-
60
-
61
-
62
-
63
-
64
-
65
-
66
-
67
-
68
-
69
-
70
-
71
-
72
-
73
-
74
-
75
-
76
-
77
-
78
-
79
-
80
-
81
-
82
-
83
-
84
-
85
-
86
-
87
-
88
-
89
-
90
-
91
-
92
-
93
-
94
-
95
-
96
-
97
-
98
-
99
-
100
-
101
-
102
-
103
-
104
-
105
-
106
-
107
-
108
-
109
-
110
-
111
-
112
-
113
-
114
-
115
-
116
-
117
-
118
-
119
-
120
-
121
-
122
-
123
-
124
-
125
-
126
-
127
-
128
-
129
-
130
-
131
-
132
-
133
-
134
-
135
-
136
-
137
-
138
-
139
-
140
-
141
-
142
-
143
-
144
-
145
-
146
-
147
-
148
-
149
-
150
-
 151
151 -
 152
152 -
 153
153 -
 154
154 -
 155
155 -
 156
156 -
 157
157 -
 158
158 -
 159
159 -
 160
160 -
 161
161 -
 162
162 -
 163
163 -
 164
164 -
 165
165 -
 166
166 -
 167
167 -
 168
168 -
 169
169 -
 170
170 -
 171
171 -
172
-
173
-
174
-
175
-
176
-
177
-
178
-
179
-
180
-
181
-
182
-
183
-
184
-
185
-
186
-
187
-
188
 |
 |

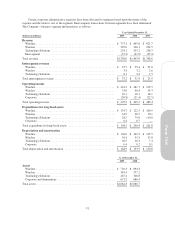
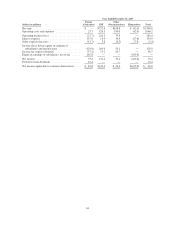
Certain corporate administrative expenses have been allocated to segments based upon the nature of the
expense and the relative size of the segment. Intercompany transactions between segments have been eliminated.
The Company’s business segment information is as follows:
Year Ended December 31,
(dollars in millions) 2009 2008 2007
Revenue
Wireline ....................................................... $ 773.1 $ 803.6 $ 821.7
Wireless ....................................................... 307.0 316.1 294.5
Technology Solutions ............................................ 293.1 315.2 258.3
Intersegment ................................................... (37.2) (31.9) (25.9)
Total revenue ..................................................... $1,336.0 $1,403.0 $1,348.6
Intersegment revenue
Wireline ....................................................... $ 25.7 $ 25.4 $ 21.8
Wireless ....................................................... 3.4 3.2 2.6
Technology Solutions ............................................ 8.1 3.3 1.5
Total intersegment revenue .......................................... $ 37.2 $ 31.9 $ 25.9
Operating income
Wireline ....................................................... $ 261.2 $ 261.7 $ 252.5
Wireless ....................................................... 33.0 46.8 34.3
Technology Solutions ............................................ 22.1 18.1 18.1
Corporate ...................................................... (20.8) (21.4) (22.5)
Total operating income ............................................. $ 295.5 $ 305.2 $ 282.4
Expenditures for long-lived assets
Wireline ....................................................... $ 134.7 $ 122.5 $ 100.9
Wireless ....................................................... 34.9 48.7 50.1
Technology Solutions ............................................ 28.5 79.0 110.8
Corporate ...................................................... 0.4 0.7 —
Total expenditure for long-lived assets ................................. $ 198.5 $ 250.9 $ 261.8
Depreciation and amortization
Wireline ....................................................... $ 104.6 $ 101.9 $ 105.5
Wireless ....................................................... 39.4 35.5 37.8
Technology Solutions ............................................ 20.5 16.3 7.4
Corporate ...................................................... 0.4 0.2 0.1
Total depreciation and amortization ................................... $ 164.9 $ 153.9 $ 150.8
As of December 31,
2009 2008
Assets
Wireline ....................................................... $ 720.3 $ 694.3
Wireless ....................................................... 383.4 377.2
Technology Solutions ............................................ 287.4 328.8
Corporate and eliminations ........................................ 673.2 686.4
Total assets ...................................................... $2,064.3 $2,086.7
91
Form 10-K