Cincinnati Bell 2009 Annual Report Download - page 169
Download and view the complete annual report
Please find page 169 of the 2009 Cincinnati Bell annual report below. You can navigate through the pages in the report by either clicking on the pages listed below, or by using the keyword search tool below to find specific information within the annual report.-
 1
1 -
2
-
3
-
4
-
5
-
6
-
7
-
8
-
9
-
10
-
11
-
12
-
13
-
14
-
15
-
16
-
17
-
18
-
19
-
20
-
21
-
22
-
23
-
24
-
25
-
26
-
27
-
28
-
29
-
30
-
31
-
32
-
33
-
34
-
35
-
36
-
37
-
38
-
39
-
40
-
41
-
42
-
43
-
44
-
45
-
46
-
47
-
48
-
49
-
50
-
51
-
52
-
53
-
54
-
55
-
56
-
57
-
58
-
59
-
60
-
61
-
62
-
63
-
64
-
65
-
66
-
67
-
68
-
69
-
70
-
71
-
72
-
73
-
74
-
75
-
76
-
77
-
78
-
79
-
80
-
81
-
82
-
83
-
84
-
85
-
86
-
87
-
88
-
89
-
90
-
91
-
92
-
93
-
94
-
95
-
96
-
97
-
98
-
99
-
100
-
101
-
102
-
103
-
104
-
105
-
106
-
107
-
108
-
109
-
110
-
111
-
112
-
113
-
114
-
115
-
116
-
117
-
118
-
119
-
120
-
121
-
122
-
123
-
124
-
125
-
126
-
127
-
128
-
129
-
130
-
131
-
132
-
133
-
134
-
135
-
136
-
137
-
138
-
139
-
140
-
141
-
142
-
143
-
144
-
145
-
146
-
147
-
148
-
149
-
150
-
151
-
152
-
153
-
154
-
155
-
156
-
157
-
158
-
 159
159 -
 160
160 -
 161
161 -
 162
162 -
 163
163 -
 164
164 -
 165
165 -
 166
166 -
 167
167 -
 168
168 -
 169
169 -
 170
170 -
 171
171 -
 172
172 -
 173
173 -
 174
174 -
 175
175 -
 176
176 -
 177
177 -
 178
178 -
 179
179 -
180
-
181
-
182
-
183
-
184
-
185
-
186
-
187
-
188
 |
 |

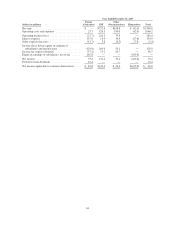
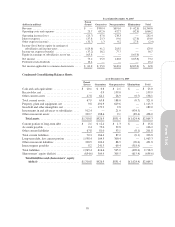
Year Ended December 31, 2007
(dollars in millions)
Parent
(Issuer) Guarantors Non-guarantors Eliminations Total
Revenue .................................... $ — $700.4 $691.0 $ (42.8) $1,348.6
Operating costs and expenses ................... 23.7 632.6 452.7 (42.8) 1,066.2
Operating income (loss) ....................... (23.7) 67.8 238.3 — 282.4
Interest expense .............................. 137.8 25.3 19.6 (27.8) 154.9
Other expense (income) ........................ (31.7) 1.3 0.2 27.8 (2.4)
Income (loss) before equity in earnings of
subsidiaries and income taxes ................. (129.8) 41.2 218.5 — 129.9
Income tax expense (benefit) ................... (37.2) 16.2 77.7 — 56.7
Equity in earnings of subsidiaries, net of tax ....... 165.8 — — (165.8) —
Net income ................................. 73.2 25.0 140.8 (165.8) 73.2
Preferred stock dividends ...................... 10.4 — — — 10.4
Net income applicable to common shareowners ..... $ 62.8 $ 25.0 $140.8 $(165.8) $ 62.8
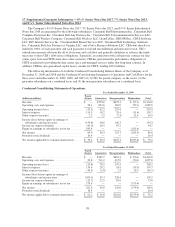
Condensed Consolidating Balance Sheets
As of December 31, 2009
Parent
(Issuer) Guarantors Non-guarantors Eliminations Total
Cash and cash equivalents .................. $ 20.1 $ 0.8 $ 2.1 $ — $ 23.0
Receivables, net .......................... — 0.9 159.0 — 159.9
Other current assets ....................... 47.8 64.1 26.9 (0.7) 138.1
Total current assets ........................ 67.9 65.8 188.0 (0.7) 321.0
Property, plant and equipment, net ........... 0.8 492.9 629.6 — 1,123.3
Goodwill and other intangibles, net ........... — 179.2 2.8 — 182.0
Investments in and advances to subsidiaries .... 912.4 — 21.9 (934.3) —
Other noncurrent assets .................... 329.7 188.6 9.1 (89.4) 438.0
Total assets ........................... $1,310.8 $926.5 $851.4 $(1,024.4) $2,064.3
Current portion of long-term debt ............ $ 2.1 $ 12.4 $ 1.3 $ — $ 15.8
Accounts payable ......................... 0.4 73.0 32.8 — 106.2
Other current liabilities .................... 67.8 81.0 53.1 (0.1) 201.8
Total current liabilities ..................... 70.3 166.4 87.2 (0.1) 323.8
Long-term debt, less current portion .......... 1,558.4 104.5 300.4 — 1,963.3
Other noncurrent liabilities ................. 328.5 104.4 88.9 (90.0) 431.8
Intercompany payables .................... 8.2 241.3 69.4 (318.9) —
Total liabilities ........................... 1,965.4 616.6 545.9 (409.0) 2,718.9
Shareowners’ equity (deficit) ................ (654.6) 309.9 305.5 (615.4) (654.6)
Total liabilities and shareowners’ equity
(deficit) ............................ $1,310.8 $926.5 $851.4 $(1,024.4) $2,064.3
99
Form 10-K