Cincinnati Bell 2009 Annual Report Download - page 104
Download and view the complete annual report
Please find page 104 of the 2009 Cincinnati Bell annual report below. You can navigate through the pages in the report by either clicking on the pages listed below, or by using the keyword search tool below to find specific information within the annual report.-
 1
1 -
2
-
3
-
4
-
5
-
6
-
7
-
8
-
9
-
10
-
11
-
12
-
13
-
14
-
15
-
16
-
17
-
18
-
19
-
20
-
21
-
22
-
23
-
24
-
25
-
26
-
27
-
28
-
29
-
30
-
31
-
32
-
33
-
34
-
35
-
36
-
37
-
38
-
39
-
40
-
41
-
42
-
43
-
44
-
45
-
46
-
47
-
48
-
49
-
50
-
51
-
52
-
53
-
54
-
55
-
56
-
57
-
58
-
59
-
60
-
61
-
62
-
63
-
64
-
65
-
66
-
67
-
68
-
69
-
70
-
71
-
72
-
73
-
74
-
75
-
76
-
77
-
78
-
79
-
80
-
81
-
82
-
83
-
84
-
85
-
86
-
87
-
88
-
89
-
90
-
91
-
92
-
93
-
 94
94 -
 95
95 -
 96
96 -
 97
97 -
 98
98 -
 99
99 -
 100
100 -
 101
101 -
 102
102 -
 103
103 -
 104
104 -
 105
105 -
 106
106 -
 107
107 -
 108
108 -
 109
109 -
 110
110 -
 111
111 -
 112
112 -
 113
113 -
 114
114 -
115
-
116
-
117
-
118
-
119
-
120
-
121
-
122
-
123
-
124
-
125
-
126
-
127
-
128
-
129
-
130
-
131
-
132
-
133
-
134
-
135
-
136
-
137
-
138
-
139
-
140
-
141
-
142
-
143
-
144
-
145
-
146
-
147
-
148
-
149
-
150
-
151
-
152
-
153
-
154
-
155
-
156
-
157
-
158
-
159
-
160
-
161
-
162
-
163
-
164
-
165
-
166
-
167
-
168
-
169
-
170
-
171
-
172
-
173
-
174
-
175
-
176
-
177
-
178
-
179
-
180
-
181
-
182
-
183
-
184
-
185
-
186
-
187
-
188
 |
 |

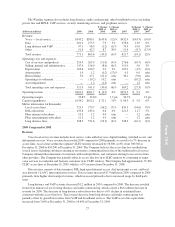
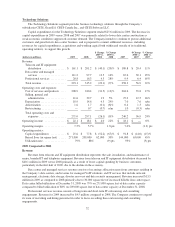
2008 Compared to 2007
The decrease in corporate costs of $1.1 million from 2007 is due to lower expense related to incentive and
deferred compensation plans partially offset by higher expenses of $2.0 million related to a settlement of a patent
lawsuit.
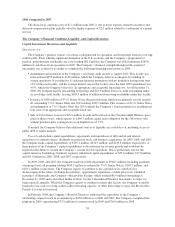
The Company’s Financial Condition, Liquidity, and Capital Resources
Capital Investment, Resources and Liquidity
Short-term view
The Company’s primary sources of cash are cash generated by operations and borrowings from its revolving
credit facility. Even with the significant disruption in the U.S. economy and the Company’s prepayment of
pension, postretirement and health care costs totaling $82.6 million, the Company was able to generate $265.6
million of cash flows from operations in 2009. The Company’s financial strength throughout this period of
uncertainty was evident by its ability to complete the following financing transactions in 2009:
•Amendment and extension of the Company’s revolving credit facility to August 2012. This facility was
reduced from $250 million to $210 million, which the Company believes is adequate for funding its
current operations. It is funded by 11 different financial institutions with no institution having more than
12% of the total facility, and the average interest rate on this facility since the June 2009 amendment was
4.0%, which the Company believes is an appropriate and acceptable financing cost. As of December 31,
2009, the Company had no outstanding borrowings and $24.5 million letters of credit outstanding under
its revolving credit facility, leaving $185.5 million of additional borrowing availability under this facility.
•Issuance of $500 million of 8
1
⁄
4
% Senior Notes, the proceeds from which were primarily used to redeem
all outstanding 7
1
⁄
4
% Senior Notes due 2013 totaling $439.9 million. This issuance of 8
1
⁄
4
% Senior Notes
and redemption of 7
1
⁄
4
% Senior Notes due 2013 extends the Company’s bond maturities for an additional
four years at an appropriate and acceptable fixed rate.
•Sale of 196 wireless towers for $99.9 million in cash and leaseback of the Cincinnati Bell Wireless space
used on those towers, which equates to a $46.7 million capital lease obligation for the 148 towers sold
without purchase price contingencies at an implied rate of 7.5%.
If needed, the Company believes that additional sources of liquidity are available to it, including access to
public debt or equity markets.
Uses of cash include capital expenditures, repayments and repurchases of debt and related interest,
repurchases of common shares, dividends on preferred stock, and business acquisitions. In 2009, 2008, and 2007,
the Company made capital expenditures of $195.1 million, $230.9 million, and $233.8 million, respectively. A
large portion of the Company’s capital expenditures is discretionary for revenue growth and would not be
required in the future to sustain the Company’s current level of operations. This is particularly true for the
capital-intensive Technology Solutions segment, which had capital expenditures of $25.6 million, $77.8 million,
and $91.8 million in 2009, 2008, and 2007, respectively.
In 2009, 2008, and 2007, the Company made total debt repayments of $506.5 million (including payments
of principal and call premium totaling $450.5 million to redeem the 7
1
⁄
4
% Senior Notes), $105.7 million, and
$219.1 million, respectively. The Company expects to continue to use a portion of its cash flows for
de-leveraging in the future, including discretionary, opportunistic repurchases of debt prior to its scheduled
maturities. Additionally, the Company’s Receivables Facility, which totaled $85.9 million outstanding at
December 31, 2009 and is described further in Note 7 to the Consolidated Financial Statements, is subject to
bank renewals annually. While the Company expects to continue to renew this facility, the Company would be
required to use cash, revolving credit facility borrowing capacity, or other borrowings to repay the Receivables
Facility if it were not renewed.
In February 2008, the Company’s Board of Directors authorized the repurchase of the Company’s
outstanding common stock in an amount up to $150 million over 2008 and 2009. The Company completed this
program in 2009, repurchasing $73.2 million of common stock in 2009 and $76.8 million in 2008.
34