Cincinnati Bell 2009 Annual Report Download - page 102
Download and view the complete annual report
Please find page 102 of the 2009 Cincinnati Bell annual report below. You can navigate through the pages in the report by either clicking on the pages listed below, or by using the keyword search tool below to find specific information within the annual report.-
 1
1 -
2
-
3
-
4
-
5
-
6
-
7
-
8
-
9
-
10
-
11
-
12
-
13
-
14
-
15
-
16
-
17
-
18
-
19
-
20
-
21
-
22
-
23
-
24
-
25
-
26
-
27
-
28
-
29
-
30
-
31
-
32
-
33
-
34
-
35
-
36
-
37
-
38
-
39
-
40
-
41
-
42
-
43
-
44
-
45
-
46
-
47
-
48
-
49
-
50
-
51
-
52
-
53
-
54
-
55
-
56
-
57
-
58
-
59
-
60
-
61
-
62
-
63
-
64
-
65
-
66
-
67
-
68
-
69
-
70
-
71
-
72
-
73
-
74
-
75
-
76
-
77
-
78
-
79
-
80
-
81
-
82
-
83
-
84
-
85
-
86
-
87
-
88
-
89
-
90
-
91
-
 92
92 -
 93
93 -
 94
94 -
 95
95 -
 96
96 -
 97
97 -
 98
98 -
 99
99 -
 100
100 -
 101
101 -
 102
102 -
 103
103 -
 104
104 -
 105
105 -
 106
106 -
 107
107 -
 108
108 -
 109
109 -
 110
110 -
 111
111 -
 112
112 -
113
-
114
-
115
-
116
-
117
-
118
-
119
-
120
-
121
-
122
-
123
-
124
-
125
-
126
-
127
-
128
-
129
-
130
-
131
-
132
-
133
-
134
-
135
-
136
-
137
-
138
-
139
-
140
-
141
-
142
-
143
-
144
-
145
-
146
-
147
-
148
-
149
-
150
-
151
-
152
-
153
-
154
-
155
-
156
-
157
-
158
-
159
-
160
-
161
-
162
-
163
-
164
-
165
-
166
-
167
-
168
-
169
-
170
-
171
-
172
-
173
-
174
-
175
-
176
-
177
-
178
-
179
-
180
-
181
-
182
-
183
-
184
-
185
-
186
-
187
-
188
 |
 |

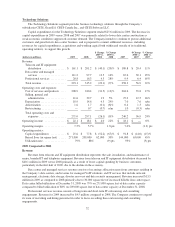
Technology Solutions
The Technology Solutions segment provides business technology solutions through the Company’s
subsidiaries CBTS, GramTel, CBTS Canada Inc., and CBTS Software LLC.
Capital expenditures for the Technology Solutions segment totaled $25.6 million in 2009. The decrease in
capital expenditures in 2009 versus 2008 and 2007 was primarily related to lower data center construction as
weak economic conditions suppressed customer demand. The Company intends to continue to pursue additional
customers and growth in its data center business, and is prepared to commit additional resources, including
resources for capital expenditures, acquisitions and working capital both within and outside of its traditional
operating territory, to support this growth.
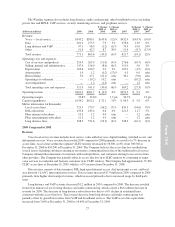
(dollars in millions) 2009 2008
$ Change
2009 vs.
2008
% Change
2009 vs.
2008 2007
$ Change
2008 vs.
2007
% Change
2008 vs.
2007
Revenue:
Telecom and IT equipment
distribution ................. $ 161.1 $ 201.2 $ (40.1) (20)% $ 180.8 $ 20.4 11%
Data center and managed
services ................... 111.2 97.7 13.5 14% 67.6 30.1 45%
Professional services ........... 20.8 16.3 4.5 28% 9.9 6.4 65%
Total revenue ................. 293.1 315.2 (22.1) (7)% 258.3 56.9 22%
Operating costs and expenses:
Cost of services and products .... 208.9 240.4 (31.5) (13)% 204.6 35.8 17%
Selling, general and
administrative .............. 41.6 39.7 1.9 5% 27.2 12.5 46%
Depreciation .................. 18.9 14.6 4.3 29% 7.0 7.6 n/m
Amortization ................. 1.6 1.7 (0.1) (6)% 0.4 1.3 n/m
Restructuring ................. — 0.7 (0.7) n/m 1.0 (0.3) n/m
Total operating costs and
expenses ................... 271.0 297.1 (26.1) (9)% 240.2 56.9 24%
Operating income ............... $ 22.1 $ 18.1 $ 4.0 22% $ 18.1 $ — 0%
Operating margin ................ 7.5% 5.7% 1.8 pts 7.0% (1.3) pts
Operating metrics:
Capital expenditures ........... $ 25.6 $ 77.8 $ (52.2) (67)% $ 91.8 $ (14.0) (15)%
Raised floor (in square feet) ..... 271,000 209,000 62,000 30% 144,000 65,000 45%
Utilization rate ................ 79% 88% (9)pts 93% (5)pts
2009 Compared to 2008
Revenue
Revenue from telecom and IT equipment distribution represents the sale, installation, and maintenance of
major, branded IT and telephony equipment. Revenue from telecom and IT equipment distribution decreased by
$40.1 million in 2009 versus 2008 primarily as a result of lower capital spending by business customers,
particularly in the first half of 2009, due to the decline in the economy.
Data center and managed services revenue consists of recurring collocation rents from customers residing in
the Company’s data centers, and revenue for managed VoIP solutions, and IT services that include network
management, electronic data storage, disaster recovery and data security management. Revenue increased $13.5
million in 2009 as compared to 2008 primarily due to 30,000 square feet of increased billable data center space.
Data center billed utilization at December 31, 2009 was 79% on 271,000 square feet of data center capacity
compared to billed utilization of 88% on 209,000 square feet of data center capacity at December 31, 2008.
Professional services revenue consists of long-term and short-term IT outsourcing and consulting
engagements. Revenue for 2009 increased by $4.5 million compared to 2008. The Company continues to expand
its team of recruiting and hiring personnel in order to focus on selling these outsourcing and consulting
engagements.
32