Cincinnati Bell 2009 Annual Report Download - page 152
Download and view the complete annual report
Please find page 152 of the 2009 Cincinnati Bell annual report below. You can navigate through the pages in the report by either clicking on the pages listed below, or by using the keyword search tool below to find specific information within the annual report.-
 1
1 -
2
-
3
-
4
-
5
-
6
-
7
-
8
-
9
-
10
-
11
-
12
-
13
-
14
-
15
-
16
-
17
-
18
-
19
-
20
-
21
-
22
-
23
-
24
-
25
-
26
-
27
-
28
-
29
-
30
-
31
-
32
-
33
-
34
-
35
-
36
-
37
-
38
-
39
-
40
-
41
-
42
-
43
-
44
-
45
-
46
-
47
-
48
-
49
-
50
-
51
-
52
-
53
-
54
-
55
-
56
-
57
-
58
-
59
-
60
-
61
-
62
-
63
-
64
-
65
-
66
-
67
-
68
-
69
-
70
-
71
-
72
-
73
-
74
-
75
-
76
-
77
-
78
-
79
-
80
-
81
-
82
-
83
-
84
-
85
-
86
-
87
-
88
-
89
-
90
-
91
-
92
-
93
-
94
-
95
-
96
-
97
-
98
-
99
-
100
-
101
-
102
-
103
-
104
-
105
-
106
-
107
-
108
-
109
-
110
-
111
-
112
-
113
-
114
-
115
-
116
-
117
-
118
-
119
-
120
-
121
-
122
-
123
-
124
-
125
-
126
-
127
-
128
-
129
-
130
-
131
-
132
-
133
-
134
-
135
-
136
-
137
-
138
-
139
-
140
-
141
-
 142
142 -
 143
143 -
 144
144 -
 145
145 -
 146
146 -
 147
147 -
 148
148 -
 149
149 -
 150
150 -
 151
151 -
 152
152 -
 153
153 -
 154
154 -
 155
155 -
 156
156 -
 157
157 -
 158
158 -
 159
159 -
 160
160 -
 161
161 -
 162
162 -
163
-
164
-
165
-
166
-
167
-
168
-
169
-
170
-
171
-
172
-
173
-
174
-
175
-
176
-
177
-
178
-
179
-
180
-
181
-
182
-
183
-
184
-
185
-
186
-
187
-
188
 |
 |

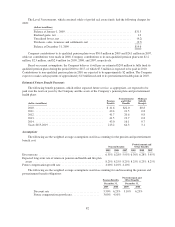
The Level 3 investments, which consisted solely of pooled real estate funds, had the following changes for
2009:
(dollars in millions)
Balance at January 1, 2009 .............................................. $31.3
Realized gains, net .................................................... 1.2
Unrealized losses, net .................................................. (9.2)
Purchases, sales, issuances and settlements, net ............................. (3.7)
Balance at December 31, 2009 ........................................... $19.6
Company contributions to its qualified pension plans were $50.0 million in 2009 and $24.1 million in 2007,
while no contributions were made in 2008. Company contributions to its non-qualified pension plan were $2.2
million, $2.3 million, and $2.4 million for 2009, 2008, and 2007, respectively.
Based on current assumptions, the Company believes it will pay an estimated $203 million to fully fund its
qualified pension plans during the period 2010 to 2017, of which $7.5 million is expected to be paid in 2010.
Contributions to non-qualified pension plans in 2010 are expected to be approximately $2 million. The Company
expects to make cash payments of approximately $13 million related to its postretirement health plans in 2010.
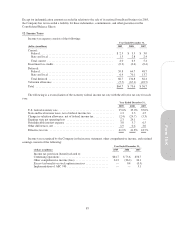
Estimated Future Benefit Payments
The following benefit payments, which reflect expected future service, as appropriate, are expected to be
paid over the next ten years by the Company and the assets of the Company’s pension plans and postretirement
health plans:
(dollars in millions)
Pension
Benefits
Postretirement
and Other
Benefits
Medicare
Subsidy
Receipts
2010 ................................................ $ 41.6 $22.0 $0.8
2011 ................................................ 42.4 21.5 0.8
2012 ................................................ 41.7 20.6 0.8
2013 ................................................ 41.5 19.7 0.8
2014 ................................................ 43.0 16.1 0.7
Years 2015-2019 ...................................... 213.2 64.3 3.1
Assumptions
The following are the weighted average assumptions used in accounting for the pension and postretirement
benefit cost:
Pension Benefits
Postretirement and
Other Benefits
2009 2008 2007 2009 2008 2007
Discount rate ............................................. 6.35% 6.28% 5.95% 6.30% 6.28% 5.95%
Expected long-term rate of return on pension and health and life plan
assets ................................................. 8.25% 8.25% 8.25% 8.25% 8.25% 8.25%
Future compensation growth rate ............................. 4.00% 4.10% 4.10%
The following are the weighted average assumptions used in accounting for and measuring the pension and
postretirement benefit obligations:
Pension Benefits
Postretirement and
Other Benefits
December 31, December 31,
2009 2008 2009 2008
Discount rate .................................. 5.50% 6.25% 5.10% 6.25%
Future compensation growth rate ................... 3.00% 4.10%
82