Cincinnati Bell 2009 Annual Report Download - page 101
Download and view the complete annual report
Please find page 101 of the 2009 Cincinnati Bell annual report below. You can navigate through the pages in the report by either clicking on the pages listed below, or by using the keyword search tool below to find specific information within the annual report.-
 1
1 -
2
-
3
-
4
-
5
-
6
-
7
-
8
-
9
-
10
-
11
-
12
-
13
-
14
-
15
-
16
-
17
-
18
-
19
-
20
-
21
-
22
-
23
-
24
-
25
-
26
-
27
-
28
-
29
-
30
-
31
-
32
-
33
-
34
-
35
-
36
-
37
-
38
-
39
-
40
-
41
-
42
-
43
-
44
-
45
-
46
-
47
-
48
-
49
-
50
-
51
-
52
-
53
-
54
-
55
-
56
-
57
-
58
-
59
-
60
-
61
-
62
-
63
-
64
-
65
-
66
-
67
-
68
-
69
-
70
-
71
-
72
-
73
-
74
-
75
-
76
-
77
-
78
-
79
-
80
-
81
-
82
-
83
-
84
-
85
-
86
-
87
-
88
-
89
-
90
-
 91
91 -
 92
92 -
 93
93 -
 94
94 -
 95
95 -
 96
96 -
 97
97 -
 98
98 -
 99
99 -
 100
100 -
 101
101 -
 102
102 -
 103
103 -
 104
104 -
 105
105 -
 106
106 -
 107
107 -
 108
108 -
 109
109 -
 110
110 -
 111
111 -
112
-
113
-
114
-
115
-
116
-
117
-
118
-
119
-
120
-
121
-
122
-
123
-
124
-
125
-
126
-
127
-
128
-
129
-
130
-
131
-
132
-
133
-
134
-
135
-
136
-
137
-
138
-
139
-
140
-
141
-
142
-
143
-
144
-
145
-
146
-
147
-
148
-
149
-
150
-
151
-
152
-
153
-
154
-
155
-
156
-
157
-
158
-
159
-
160
-
161
-
162
-
163
-
164
-
165
-
166
-
167
-
168
-
169
-
170
-
171
-
172
-
173
-
174
-
175
-
176
-
177
-
178
-
179
-
180
-
181
-
182
-
183
-
184
-
185
-
186
-
187
-
188
 |
 |

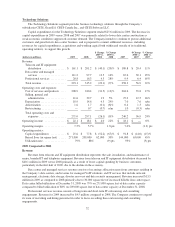
Costs and Expenses
Cost of services and products consists largely of network operation costs, interconnection expenses with
other telecommunications providers, roaming expense (which is incurred for subscribers to use their handsets in
the territories of other wireless service providers), and cost of handsets and accessories sold. These expenses
decreased $1.0 million during 2009 versus the prior year period. The decrease was primarily attributable to lower
operating taxes of $2.8 million and a $1.3 million decrease in third party service provider costs. These decreases
were offset by a $3.4 million increase in handset costs, primarily due to increased Company handset subsidies to
attract new smartphone customers.
Selling, general and administrative expenses decreased $2.5 million for 2009 compared to 2008, primarily
due to lower distributor commissions of $2.2 million resulting from lower activations, as well as lower
advertising and other costs partially offset by an increase in bad debt expense of $0.9 million.
The increase in depreciation expense of $4.5 million is related to the 3G wireless network that was launched
in late 2008.
The decrease in amortization expense from the prior year is due to the Company’s accelerated amortization
methodology.
During 2009, the Company sold almost all of its owned wireless licenses for areas outside of its Cincinnati
and Dayton operating territories. These licenses, which were primarily for the Indianapolis, Indiana region, were
sold for $6.0 million, resulting in a loss on sale of the spectrum assets of $4.8 million.
2008 Compared to 2007
Revenue
Service revenue increased by $23.0 million during 2008 as compared to 2007 primarily due to the
following:
•Postpaid service revenue increased $20.3 million due to an increase in average subscribers and ARPU.
Postpaid subscribers increased from 400,400 subscribers at December 31, 2007 to 403,700 at
December 31, 2008. The average monthly churn increased to 2.1% for 2008 compared to 1.6% for 2007.
The increase in churn resulted from increased competition and Company-initiated disconnections of
customers with credit problems. ARPU increased from $46.55 in 2007 to $48.69 in 2008. The ARPU
increase includes a 29% increase in data ARPU; and
•Prepaid service revenue increased $2.7 million compared to 2007 primarily due to an increase in ARPU of
$2.59 partially offset by a lower number of subscribers. The number of prepaid subscribers at
December 31, 2008 was 146,900, down from 170,600 prepaid subscribers at December 31, 2007. The
Company focused its marketing in 2008 on higher usage rate plans, which generated higher ARPU but led
to the decrease in the number of prepaid subscribers.
Equipment revenue decreased slightly from $27.0 million in 2007 to $25.6 million in 2008 primarily due to
lower handset revenue per unit and lower prepaid subscriber activations.
Costs and Expenses
Cost of services and products increased $10.5 million during 2008 versus 2007. The increase was primarily
attributable to a $9.7 million increase in network costs due to increased usage per subscriber and a $1.9 million
increase in handset and subsidy costs, primarily due to Company initiatives to attract new customers and to retain
existing customers. These increases were partially offset by lower operating taxes.
Selling, general and administrative expenses increased $2.5 million for 2008 compared to 2007, primarily
due to an increase in bad debt expense.
The decrease in amortization expense from 2007 is due to the Company’s accelerated amortization
methodology.
31
Form 10-K