Cincinnati Bell 2009 Annual Report Download - page 95
Download and view the complete annual report
Please find page 95 of the 2009 Cincinnati Bell annual report below. You can navigate through the pages in the report by either clicking on the pages listed below, or by using the keyword search tool below to find specific information within the annual report.-
 1
1 -
2
-
3
-
4
-
5
-
6
-
7
-
8
-
9
-
10
-
11
-
12
-
13
-
14
-
15
-
16
-
17
-
18
-
19
-
20
-
21
-
22
-
23
-
24
-
25
-
26
-
27
-
28
-
29
-
30
-
31
-
32
-
33
-
34
-
35
-
36
-
37
-
38
-
39
-
40
-
41
-
42
-
43
-
44
-
45
-
46
-
47
-
48
-
49
-
50
-
51
-
52
-
53
-
54
-
55
-
56
-
57
-
58
-
59
-
60
-
61
-
62
-
63
-
64
-
65
-
66
-
67
-
68
-
69
-
70
-
71
-
72
-
73
-
74
-
75
-
76
-
77
-
78
-
79
-
80
-
81
-
82
-
83
-
84
-
 85
85 -
 86
86 -
 87
87 -
 88
88 -
 89
89 -
 90
90 -
 91
91 -
 92
92 -
 93
93 -
 94
94 -
 95
95 -
 96
96 -
 97
97 -
 98
98 -
 99
99 -
 100
100 -
 101
101 -
 102
102 -
 103
103 -
 104
104 -
 105
105 -
106
-
107
-
108
-
109
-
110
-
111
-
112
-
113
-
114
-
115
-
116
-
117
-
118
-
119
-
120
-
121
-
122
-
123
-
124
-
125
-
126
-
127
-
128
-
129
-
130
-
131
-
132
-
133
-
134
-
135
-
136
-
137
-
138
-
139
-
140
-
141
-
142
-
143
-
144
-
145
-
146
-
147
-
148
-
149
-
150
-
151
-
152
-
153
-
154
-
155
-
156
-
157
-
158
-
159
-
160
-
161
-
162
-
163
-
164
-
165
-
166
-
167
-
168
-
169
-
170
-
171
-
172
-
173
-
174
-
175
-
176
-
177
-
178
-
179
-
180
-
181
-
182
-
183
-
184
-
185
-
186
-
187
-
188
 |
 |

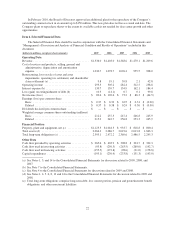
Results of Operations
Consolidated Overview
The financial results for 2009, 2008, and 2007 referred to in this discussion should be read in conjunction
with the Consolidated Statements of Operations and Note 14 to the Consolidated Financial Statements.
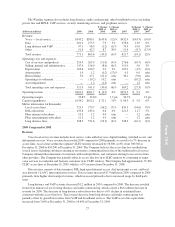
2009 Compared to 2008
Consolidated revenue totaled $1,336.0 million in 2009, a decrease of $67.0 million compared to $1,403.0
million in 2008. The decrease was primarily due to the following:
•$30.5 million lower revenues in the Wireline segment due to lower voice revenue partially offset by
higher data and Fioptics revenue;
•$22.1 million lower revenues in the Technology Solutions segment primarily due to lower telecom and IT
equipment distribution revenue partially offset by increased revenue from data center and managed
services; and
•$9.1 million lower revenues in the Wireless segment primarily due to lower postpaid service revenue and
lower equipment revenue.
Operating income for 2009 was $295.5 million, a decrease of $9.7 million compared to 2008. The decrease
was primarily due to the following:
•$13.8 million decrease in Wireless segment operating income primarily due to lower postpaid service
revenue, higher subsidies to attract new smartphone subscribers, loss on sale of spectrum and higher
depreciation partially offset by lower operating costs; and
•$4.0 million increase in Technology Solutions segment due to increased data center and managed services
revenue and lower incentive compensation costs offset by lower IT equipment distribution revenue, higher
payroll and employee related costs and higher depreciation.
Interest expense decreased to $130.7 million for 2009 compared to $139.7 million in 2008. The decrease
compared to last year is primarily attributable to lower short-term interest rates.
The loss on extinguishment of debt of $10.3 million for 2009 was primarily due to the redemption of the
Company’s 7
1
⁄
4
% Senior Notes due 2013 and was partially offset by a gain on extinguishment of a portion of the
Company’s 7
1
⁄
4
% Senior Notes due 2023 and Cincinnati Bell Telephone Notes at an average discount of 24%.
The gain on extinguishment of debt of $14.1 million for 2008 was due to the Company’s purchase and retirement
of $108.1 million of the Company’s corporate bonds at an average discount of 14%. See Note 7 to the
Consolidated Financial Statements for further details.
Other expense, net for 2008 of $3.4 million primarily resulted from unrealized losses on short-term interest
rate swap contracts. The Company did not designate these swaps as hedging instruments, which resulted in the
fair value loss on these instruments being recognized in earnings during each period that these instruments were
outstanding.
Income tax expense decreased from $73.6 million in 2008 to $64.7 million in 2009 primarily due to lower
pretax income.
The Company has certain non-deductible expenses, including interest on securities originally issued to
acquire its broadband business (the “Broadband Securities”) or securities that the Company has subsequently
issued to refinance the Broadband Securities. In periods without tax law changes, the Company expects its
effective tax rate to exceed statutory rates primarily due to the non-deductible expenses associated with the
Broadband Securities. The Company used approximately $45 million of federal and state net operating loss
carryforwards to substantially defray payment of federal and state tax liabilities. As a result, the Company had
cash income tax payments of only $6.0 million in 2009.
25
Form 10-K