Cincinnati Bell 2009 Annual Report Download - page 153
Download and view the complete annual report
Please find page 153 of the 2009 Cincinnati Bell annual report below. You can navigate through the pages in the report by either clicking on the pages listed below, or by using the keyword search tool below to find specific information within the annual report.-
 1
1 -
2
-
3
-
4
-
5
-
6
-
7
-
8
-
9
-
10
-
11
-
12
-
13
-
14
-
15
-
16
-
17
-
18
-
19
-
20
-
21
-
22
-
23
-
24
-
25
-
26
-
27
-
28
-
29
-
30
-
31
-
32
-
33
-
34
-
35
-
36
-
37
-
38
-
39
-
40
-
41
-
42
-
43
-
44
-
45
-
46
-
47
-
48
-
49
-
50
-
51
-
52
-
53
-
54
-
55
-
56
-
57
-
58
-
59
-
60
-
61
-
62
-
63
-
64
-
65
-
66
-
67
-
68
-
69
-
70
-
71
-
72
-
73
-
74
-
75
-
76
-
77
-
78
-
79
-
80
-
81
-
82
-
83
-
84
-
85
-
86
-
87
-
88
-
89
-
90
-
91
-
92
-
93
-
94
-
95
-
96
-
97
-
98
-
99
-
100
-
101
-
102
-
103
-
104
-
105
-
106
-
107
-
108
-
109
-
110
-
111
-
112
-
113
-
114
-
115
-
116
-
117
-
118
-
119
-
120
-
121
-
122
-
123
-
124
-
125
-
126
-
127
-
128
-
129
-
130
-
131
-
132
-
133
-
134
-
135
-
136
-
137
-
138
-
139
-
140
-
141
-
142
-
 143
143 -
 144
144 -
 145
145 -
 146
146 -
 147
147 -
 148
148 -
 149
149 -
 150
150 -
 151
151 -
 152
152 -
 153
153 -
 154
154 -
 155
155 -
 156
156 -
 157
157 -
 158
158 -
 159
159 -
 160
160 -
 161
161 -
 162
162 -
 163
163 -
164
-
165
-
166
-
167
-
168
-
169
-
170
-
171
-
172
-
173
-
174
-
175
-
176
-
177
-
178
-
179
-
180
-
181
-
182
-
183
-
184
-
185
-
186
-
187
-
188
 |
 |

The expected long-term rate of return on plan assets, developed using the building block approach, is based
on the mix of investments held directly by the plans and the current view of expected future returns, which is
influenced by historical averages. Changes in actual asset return experience and discount rate assumptions can
impact the Company’s operating results, financial position and cash flows.
The assumed health care cost trend rate used to measure the postretirement health benefit obligation at
December 31, 2009, was 9.0% and is assumed to decrease gradually to 4.5% by the year 2015. A one-percentage
point change in assumed health care cost trend rates would have the following effect on the postretirement
benefit costs and obligation:
(dollars in millions) 1% Increase 1% Decrease
2009 service and interest costs ................................... $0.3 ($ 0.3)
Postretirement benefit obligation at December 31, 2009 ............... 5.6 (5.1)
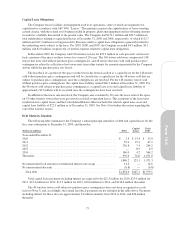
10. Shareowners’ Deficit
Common Shares
The par value of the Company’s common shares is $0.01 per share. At December 31, 2009 and 2008,
common shares outstanding were 200.4 million and 227.9 million, respectively. In 2009, the Company completed
the two-year $150 million share repurchase program authorized by the Board of Directors in February 2008. As
part of this program, in 2009, the Company repurchased 28.0 million common shares for $73.2 million and, in
2008, the Company repurchased 20.6 million common shares for $76.8 million. In 2009, the Company retired the
28.0 million shares repurchased. In 2008, the Company retired both the 20.6 million common shares repurchased
during the year along with 7.8 million shares repurchased under the Company’s 1999 share repurchase program.
At December 31, 2009 and 2008, treasury shares for common shares repurchased under certain management
deferred compensation arrangements were 0.7 million and 0.6 million, respectively, with a total cost of $2.7
million.
In February 2010, the Board of Directors approved an additional plan for the repurchase of the Company’s
outstanding common stock in an amount up to $150 million. This new plan does not have a stated end date. The
Company plans to repurchase shares to the extent its available cash is not needed for data center growth and other
opportunities.
Preferred Shares
The Company is authorized to issue 1,357,299 shares of voting preferred stock without par value and
1,000,000 shares of nonvoting preferred stock without par value. The Company issued 155,250 voting shares of
6
3
⁄
4
% cumulative convertible preferred stock at stated value. These shares were subsequently deposited into a
trust in which the underlying 155,250 shares are equivalent to 3,105,000 depositary shares. Shares of this
preferred stock can be converted at any time at the option of the holder into common stock of the Company at a
conversion rate of 1.44 shares of the Company common stock per depositary share of 6
3
⁄
4
% convertible preferred
stock. Annual dividends of $10.4 million on the outstanding 6
3
⁄
4
% convertible preferred stock are payable
quarterly in arrears in cash, or in common stock in certain circumstances if cash payment is not legally permitted.
The liquidation preference on the 6
3
⁄
4
% preferred stock is $1,000 per share (or $50 per depositary share). The
Company paid $10.4 million in dividends in 2009, 2008, and 2007.
Warrants
The Company has 17.5 million outstanding common stock warrants, which expire in March 2013, to
purchase one share of Cincinnati Bell common stock at $3.00 each. There were no exercises of warrants in 2009,
2008, or 2007.
Accumulated Other Comprehensive Loss
The Company’s shareowners’ deficit includes an accumulated other comprehensive loss that is comprised of
pension and postretirement unrecognized prior service cost, transition obligation and unrecognized actuarial
losses, net of taxes, of $136.1 million and $177.1 million at December 31, 2009 and 2008, respectively. Refer to
Note 9 for further discussion.
83
Form 10-K