Cigna 2010 Annual Report Download - page 75
Download and view the complete annual report
Please find page 75 of the 2010 Cigna annual report below. You can navigate through the pages in the report by either clicking on the pages listed below, or by using the keyword search tool below to find specific information within the annual report.-
 1
1 -
2
-
3
-
4
-
5
-
6
-
7
-
8
-
9
-
10
-
11
-
12
-
13
-
14
-
15
-
16
-
17
-
18
-
19
-
20
-
21
-
22
-
23
-
24
-
25
-
26
-
27
-
28
-
29
-
30
-
31
-
32
-
33
-
34
-
35
-
36
-
37
-
38
-
39
-
40
-
41
-
42
-
43
-
44
-
45
-
46
-
47
-
48
-
49
-
50
-
51
-
52
-
53
-
54
-
55
-
56
-
57
-
58
-
59
-
60
-
61
-
62
-
63
-
64
-
 65
65 -
 66
66 -
 67
67 -
 68
68 -
 69
69 -
 70
70 -
 71
71 -
 72
72 -
 73
73 -
 74
74 -
 75
75 -
 76
76 -
 77
77 -
 78
78 -
 79
79 -
 80
80 -
 81
81 -
 82
82 -
 83
83 -
 84
84 -
 85
85 -
86
-
87
-
88
-
89
-
90
-
91
-
92
-
93
-
94
-
95
-
96
-
97
-
98
-
99
-
100
-
101
-
102
-
103
-
104
-
105
-
106
-
107
-
108
-
109
-
110
-
111
-
112
-
113
-
114
-
115
-
116
-
117
-
118
-
119
-
120
-
121
-
122
-
123
-
124
-
125
-
126
-
127
-
128
-
129
-
130
-
131
-
132
-
133
-
134
-
135
-
136
-
137
-
138
-
139
-
140
-
141
-
142
-
143
-
144
-
145
-
146
-
147
-
148
-
149
-
150
-
151
-
152
-
153
-
154
-
155
-
156
-
157
-
158
-
159
-
160
-
161
-
162
-
163
-
164
-
165
-
166
-
167
-
168
-
169
-
170
-
171
-
172
 |
 |
CIGNA CORPORATION 2010 Form 10K 55
PART II
ITEM 7 Management’s Discussion and Analysis of Financial Condition and Results of Operations
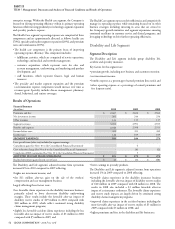
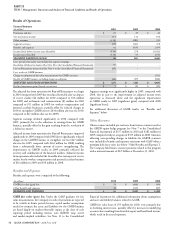
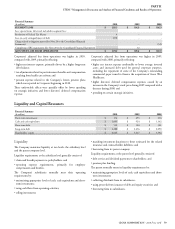
Revenues
Premiums and fees. Excluding the eff ect of foreign currency
movements, premiums and fees were $2.2 billion in 2010, compared
with reported premiums and fees of $1.9 billion in 2009, an increase
of 16%. e increase was primarily attributable to new sales growth
in the supplemental health, life and accident insurance operations,
particularly in South Korea, and rate increases and membership
growth in the expatriate employee benefi ts business. Excluding
the eff ect of foreign currency movements, premiums and fees were
$2.0 billion in 2009, compared with reported premiums and fees of
$1.9 billion in 2008, an increase of 9%. e increase was primarily
attributable to new sales growth in the supplemental health, life and
accident insurance operations, particularly in Taiwan and South
Korea, and rate actions in the expatriate employee benefi ts business.
Net investment income increased by 19% in 2010, compared with
2009. e increase was primarily due to favorable foreign currency
movements and asset growth, particularly in South Korea. Net
investment income decreased by 13% in 2009, compared with 2008.
e decrease was primarily due to unfavorable foreign currency
movements, primarily in South Korea.
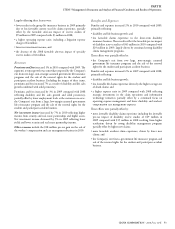
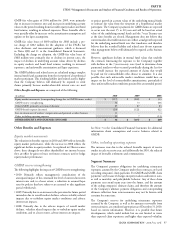
Benefi ts and Expenses
Excluding the impact of foreign currency movements, benefi ts and
expenses were $2.0 billion in 2010, compared with reported benefi ts
and expenses of $1.7 billion in 2009, an increase of 15%. ese
increases were primarily due to business growth and higher claims
in the supplemental health, life and accident insurance business,
particularly in South Korea. Excluding the impact of foreign currency
movements, benefi ts and expenses were $1.8 billion in 2009,
compared with reported benefi ts and expenses of $1.7 billion in
2008, an increase of 9%. e increase was primarily driven by higher
loss ratios, business growth, and increased amortization of deferred
acquisition costs.
Loss ratios were higher in the supplemental health, life and accident
insurance business in 2010, compared with 2009, refl ecting less
favorable claims experience. Loss ratios were lower in the expatriate
benefi ts business in 2010, compared with 2009, refl ecting favorable
claim experience and rate increases on renewal business.
Policy acquisition expenses increased in 2010, compared with 2009,
refl ecting business growth and foreign currency movements. Policy
acquisition costs decreased in 2009, compared to 2008, refl ecting
foreign currency movements partially off set by business growth
and higher amortization of acquisition costs associated with lower
persistency in the supplemental health, life and accident insurance
business.
Expense ratios increased in 2010, compared with 2009, refl ecting
the acquisition costs associated with the purchase of Vanbreda
International as well as the impact of the higher expense ratios
associated with the acquired business. Expense ratios decreased in
2009, compared with 2008, refl ecting eff ective expense management.
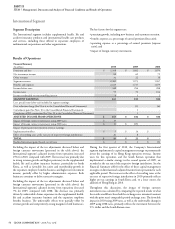
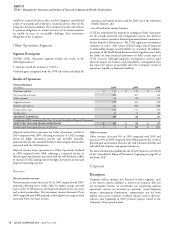
Other Items Aff ecting International Results
For the Company’s International segment, South Korea is the
single largest geographic market. South Korea generated 32% of
the segment’s revenues and 49% of the segment’s earnings in 2010.
South Korea generated 29% of the segment’s revenues and 49% of
the segment’s earnings in 2009. Due to the concentration of business
in South Korea, the International segment is exposed to potential
losses resulting from economic and geopolitical developments in
that country, as well as foreign currency movements aff ecting the
South Korean currency, which could have a signifi cant impact on the
segment’s results and the Company’s consolidated fi nancial results.
As discussed in Note 3 to the Consolidated Financial Statements,
the Company acquired Vanbreda International in August of 2010.
is acquisition further strengthens CIGNA International’s position
in the expatriate benefi ts market. Since the acquisition, earnings from
Vanbreda International have been immaterial to results of operations.
e Company expects Vanbreda International’s earnings to be
accretive in 2011.
In China, CIGNA International owns a 50% interest in a joint
venture through which its products and services are off ered. e
Company accounts for this joint venture using the equity method,
recording its share of the joint venture’s net income in other revenues.
Run-off Reinsurance Segment
Segment Description
e Company’s reinsurance operations were discontinued and are
now an inactive business in run-off mode since the sale of the U.S.
individual life, group life and accidental death reinsurance business in
2000. is segment is predominantly comprised of GMDB, GMIB,
workers’ compensation and personal accident reinsurance products.
On December 31, 2010, the Company essentially exited from its
workers compensation and personal accident reinsurance business
by purchasing retrocessional coverage from a Bermuda subsidiary of
Enstar Group Limited and transferring the ongoing administration
of this business to the reinsurer. e 2010 special item loss refl ects the
after-tax costs of this transaction.
e determination of liabilities for GMDB and GMIB requires
the Company to make critical accounting estimates. In 2008, the
Company updated the assumptions for GMIB and the eff ects of
hypothetical changes in those assumptions in connection with the
implementation of the FASB’s fair value disclosure and measurement
guidance (ASC 820). e Company describes the assumptions used
to develop the reserves for GMDB in Note 7 to the Consolidated
Financial Statements and for the assets and liabilities associated with
GMIB in Note 11 to the Consolidated Financial Statements. e
Company also provides the eff ects of hypothetical changes in those
assumptions in the Critical Accounting Estimates section of the
MD&A beginning on page 41 of this Form 10-K.
e Company excludes the results of the GMIB business from
adjusted income from operations because the fair value of GMIB
assets and liabilities must be recalculated each quarter using updated
capital market assumptions. e resulting changes in fair value,
which are reported in shareholders’ net income, are volatile and
unpredictable.