Cigna 2010 Annual Report Download - page 139
Download and view the complete annual report
Please find page 139 of the 2010 Cigna annual report below. You can navigate through the pages in the report by either clicking on the pages listed below, or by using the keyword search tool below to find specific information within the annual report.-
 1
1 -
2
-
3
-
4
-
5
-
6
-
7
-
8
-
9
-
10
-
11
-
12
-
13
-
14
-
15
-
16
-
17
-
18
-
19
-
20
-
21
-
22
-
23
-
24
-
25
-
26
-
27
-
28
-
29
-
30
-
31
-
32
-
33
-
34
-
35
-
36
-
37
-
38
-
39
-
40
-
41
-
42
-
43
-
44
-
45
-
46
-
47
-
48
-
49
-
50
-
51
-
52
-
53
-
54
-
55
-
56
-
57
-
58
-
59
-
60
-
61
-
62
-
63
-
64
-
65
-
66
-
67
-
68
-
69
-
70
-
71
-
72
-
73
-
74
-
75
-
76
-
77
-
78
-
79
-
80
-
81
-
82
-
83
-
84
-
85
-
86
-
87
-
88
-
89
-
90
-
91
-
92
-
93
-
94
-
95
-
96
-
97
-
98
-
99
-
100
-
101
-
102
-
103
-
104
-
105
-
106
-
107
-
108
-
109
-
110
-
111
-
112
-
113
-
114
-
115
-
116
-
117
-
118
-
119
-
120
-
121
-
122
-
123
-
124
-
125
-
126
-
127
-
128
-
 129
129 -
 130
130 -
 131
131 -
 132
132 -
 133
133 -
 134
134 -
 135
135 -
 136
136 -
 137
137 -
 138
138 -
 139
139 -
 140
140 -
 141
141 -
 142
142 -
 143
143 -
 144
144 -
 145
145 -
 146
146 -
 147
147 -
 148
148 -
 149
149 -
150
-
151
-
152
-
153
-
154
-
155
-
156
-
157
-
158
-
159
-
160
-
161
-
162
-
163
-
164
-
165
-
166
-
167
-
168
-
169
-
170
-
171
-
172
 |
 |

CIGNA CORPORATION 2010 Form 10K 119
PART II
ITEM 8 Financial Statements and Supplementary Data
Corporate refl ects amounts such as interest expense on corporate
debt and on uncertain tax positions, net investment income on
investments not supporting segment operations, intersegment
eliminations, compensation cost for stock options and certain
corporate overhead expenses. Beginning in 2010, the Company
began reporting the expense associated with its frozen pension plans
in Corporate. Prior periods were not restated as the eff ect on prior
periods was not material.
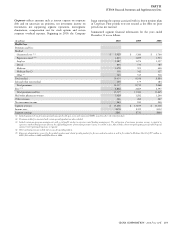
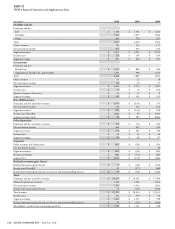
Summarized segment fi nancial information for the years ended
December 31 was as follows:
(In millions)
2010 2009 2008
Health Care
Premiums and fees:
Medical:
Guaranteed cost (1)(2) $ 3,929 $ 3,380 $ 3,704
Experience-rated (2)(3) 1,823 1,699 1,953
Stop loss 1,287 1,274 1,197
Dental 804 731 785
Medicare 1,470 595 400
Medicare Part D 558 342 327
Other (4) 543 515 518
Total medical 10,414 8,536 8,884
Life and other non-medical 103 179 184
Total premiums 10,517 8,715 9,068
Fees (2)(5) 2,802 2,669 2,597
Total premiums and fees 13,319 11,384 11,665
Mail order pharmacy revenues 1,420 1,282 1,204
Other revenues 266 262 267
Net investment income 243 181 200
Segment revenues $ 15,248 $ 13,109 $ 13,336
Income taxes $476 $399 $352
Segment earnings $861 $731 $664
(1) Includes guaranteed cost premiums primarily associated with open access and commercial HMO, as well as other risk-related products.
(2) Premiums and/or fees associated with certain specialty products are also included.
(3) Includes minimum premium arrangements with a risk profile similar to experience-rated funding arrangements. The risk portion of minimum premium revenue is reported in
experience-rated medical premium whereas the self funding portion of minimum premium revenue is recorded in fees. Also includes certain non-participating cases for which special
customer level reporting of experience is required.
(4) Other medical premiums include risk revenue for specialty products.
(5) Represents administrative service fees for medical members and related specialty product fees for non-medical members as well as fees related to Medicare Part D of $57 million in
2010, $41 million in 2009 and $69 million in 2008.