Cigna 2010 Annual Report Download - page 125
Download and view the complete annual report
Please find page 125 of the 2010 Cigna annual report below. You can navigate through the pages in the report by either clicking on the pages listed below, or by using the keyword search tool below to find specific information within the annual report.-
 1
1 -
2
-
3
-
4
-
5
-
6
-
7
-
8
-
9
-
10
-
11
-
12
-
13
-
14
-
15
-
16
-
17
-
18
-
19
-
20
-
21
-
22
-
23
-
24
-
25
-
26
-
27
-
28
-
29
-
30
-
31
-
32
-
33
-
34
-
35
-
36
-
37
-
38
-
39
-
40
-
41
-
42
-
43
-
44
-
45
-
46
-
47
-
48
-
49
-
50
-
51
-
52
-
53
-
54
-
55
-
56
-
57
-
58
-
59
-
60
-
61
-
62
-
63
-
64
-
65
-
66
-
67
-
68
-
69
-
70
-
71
-
72
-
73
-
74
-
75
-
76
-
77
-
78
-
79
-
80
-
81
-
82
-
83
-
84
-
85
-
86
-
87
-
88
-
89
-
90
-
91
-
92
-
93
-
94
-
95
-
96
-
97
-
98
-
99
-
100
-
101
-
102
-
103
-
104
-
105
-
106
-
107
-
108
-
109
-
110
-
111
-
112
-
113
-
114
-
 115
115 -
 116
116 -
 117
117 -
 118
118 -
 119
119 -
 120
120 -
 121
121 -
 122
122 -
 123
123 -
 124
124 -
 125
125 -
 126
126 -
 127
127 -
 128
128 -
 129
129 -
 130
130 -
 131
131 -
 132
132 -
 133
133 -
 134
134 -
 135
135 -
136
-
137
-
138
-
139
-
140
-
141
-
142
-
143
-
144
-
145
-
146
-
147
-
148
-
149
-
150
-
151
-
152
-
153
-
154
-
155
-
156
-
157
-
158
-
159
-
160
-
161
-
162
-
163
-
164
-
165
-
166
-
167
-
168
-
169
-
170
-
171
-
172
 |
 |

CIGNA CORPORATION 2010 Form 10K 105
PART II
ITEM 8 Financial Statements and Supplementary Data
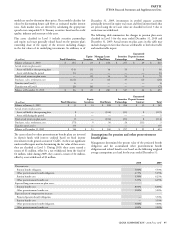
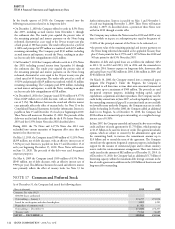
B. Commercial Mortgage Loans
Mortgage loans held by the Company are made exclusively to
commercial borrowers and are diversifi ed by property type, location
and borrower. Loans are secured by high quality, primarily completed
and substantially leased operating properties and are generally carried
at unpaid principal balances and are issued at a fi xed rate of interest.
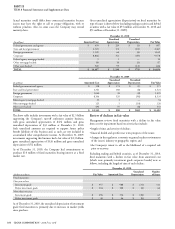
At December 31, commercial mortgage loans were distributed among
the following property types and geographic regions:
(In millions)
2010 2009
Property type
Offi ce buildings $ 1,043 $ 1,101
Apartment buildings 835 901
Industrial 619 551
Hotels 533 499
Retail facilities 418 426
Other 38 44
TOTAL $ 3,486 $ 3,522
Geographic region
Pacifi c $ 931 $ 965
South Atlantic 752 735
New England 585 566
Central 519 518
Middle Atlantic 385 408
Mountain 314 330
TOTAL $ 3,486 $ 3,522
At December 31, 2010, scheduled commercial mortgage loan
maturities were as follows (in millions): $518 in 2011, $547 in
2012, $612 in 2013, $274 in 2014 and $1,535 thereafter. Actual
maturities could diff er from contractual maturities for several reasons:
borrowers may have the right to prepay obligations, with or without
prepayment penalties: the maturity date may be extended; and loans
may be refi nanced.
As of December 31, 2010, the Company had commitments to extend
credit under commercial mortgage loan agreements of $63 million
that were diversifi ed by property type and geographic region.
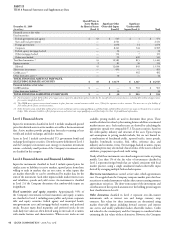
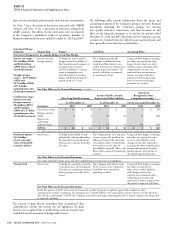
Credit Quality
e Company applies a consistent and disciplined approach to
evaluating and monitoring credit risk, beginning with the initial
underwriting of a mortgage loan and continuing throughout the
investment holding period. Mortgage origination professionals
employ an internal rating system developed from the Company’s
experience in real estate investing and mortgage lending. A quality
rating, designed to evaluate the relative risk of the transaction, is
assigned at each loan’s origination and is updated each year as part
of the annual portfolio loan review. e Company monitors credit
quality on an ongoing basis, classifying each loan as a loan in good
standing, potential problem loan or problem loan.
Quality ratings are based on internal evaluations of each loan’s specifi c
characteristics considering a number of key inputs, including real
estate market-related factors such as rental rates and vacancies, and
property-specifi c inputs such as growth rate assumptions and lease
rollover statistics. However, the two most signifi cant contributors to
the credit quality rating are the debt service coverage and loan-to-
value ratios. e debt service coverage ratio measures the amount of
property cash fl ow available to meet annual interest and principal
payments on debt. A debt service coverage ratio below 1.0 indicates
that there is not enough cash fl ow to cover the loan payments. e
loan-to-value ratio, commonly expressed as a percentage, compares
the amount of the loan to the fair value of the underlying property
collateralizing the loan. Based on property valuations and cash
fl ows estimated as part of the most recent annual review completed
in July, 2010, and considering updates for loans where material
changes were subsequently identifi ed, the portfolio’s aggregate debt
service coverage ratio was 1.38 and loan-to-value ratio was 74% as
of December 31, 2010. As of December 31, 2009, the portfolio’s
aggregate debt service coverage ratio was 1.48 and loan-to-value ratio
was 77%.
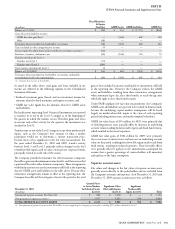
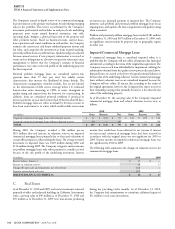
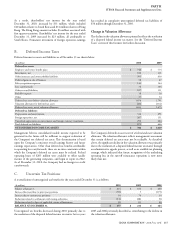
e following table summarizes the credit risk profi le of the
Company’s commercial mortgage loan portfolio based on loan-to-
value and debt service coverage ratios, as of December 31, 2010:
Loan-to-Value Ratios
(Dollars in millions)
Debt Service Coverage Ratio
Total1.30x or Greater 1.20x to 1.29x 1.10x to 1.19x 1.00x to 1.09x Less than 1.00x
Below 50% $ 324 $ — $ — $ — $ 29 $ 353
50% to 59% 409 54 56 — — 519
60% to 69% 533 73 5 28 25 664
70% to 79% 138 79 57 55 11 340
80% to 89% 267 186 165 151 69 838
90% to 99% 15 54 181 185 135 570
100% or above — — 47 43 112 202
TOTAL $ 1,686 $ 446 $ 511 $ 462 $ 381 $ 3,486