Cigna 2010 Annual Report Download - page 59
Download and view the complete annual report
Please find page 59 of the 2010 Cigna annual report below. You can navigate through the pages in the report by either clicking on the pages listed below, or by using the keyword search tool below to find specific information within the annual report.-
 1
1 -
2
-
3
-
4
-
5
-
6
-
7
-
8
-
9
-
10
-
11
-
12
-
13
-
14
-
15
-
16
-
17
-
18
-
19
-
20
-
21
-
22
-
23
-
24
-
25
-
26
-
27
-
28
-
29
-
30
-
31
-
32
-
33
-
34
-
35
-
36
-
37
-
38
-
39
-
40
-
41
-
42
-
43
-
44
-
45
-
46
-
47
-
48
-
 49
49 -
 50
50 -
 51
51 -
 52
52 -
 53
53 -
 54
54 -
 55
55 -
 56
56 -
 57
57 -
 58
58 -
 59
59 -
 60
60 -
 61
61 -
 62
62 -
 63
63 -
 64
64 -
 65
65 -
 66
66 -
 67
67 -
 68
68 -
 69
69 -
70
-
71
-
72
-
73
-
74
-
75
-
76
-
77
-
78
-
79
-
80
-
81
-
82
-
83
-
84
-
85
-
86
-
87
-
88
-
89
-
90
-
91
-
92
-
93
-
94
-
95
-
96
-
97
-
98
-
99
-
100
-
101
-
102
-
103
-
104
-
105
-
106
-
107
-
108
-
109
-
110
-
111
-
112
-
113
-
114
-
115
-
116
-
117
-
118
-
119
-
120
-
121
-
122
-
123
-
124
-
125
-
126
-
127
-
128
-
129
-
130
-
131
-
132
-
133
-
134
-
135
-
136
-
137
-
138
-
139
-
140
-
141
-
142
-
143
-
144
-
145
-
146
-
147
-
148
-
149
-
150
-
151
-
152
-
153
-
154
-
155
-
156
-
157
-
158
-
159
-
160
-
161
-
162
-
163
-
164
-
165
-
166
-
167
-
168
-
169
-
170
-
171
-
172
 |
 |
CIGNA CORPORATION 2010 Form 10K 39
PART II
ITEM 7 Management’s Discussion and Analysis of Financial Condition and Results of Operations
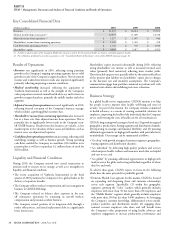
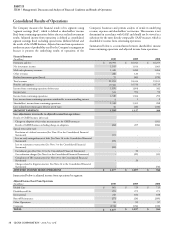
Overview of 2010 Consolidated Results
of Operations
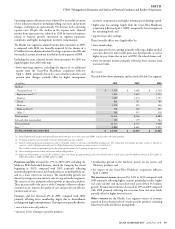
Adjusted income from operations increased 16% in 2010 compared
with 2009 primarily due to strong earnings growth in the
ongoing business segments (Health Care, Disability and Life and
International), refl ecting focused execution of the Company’s strategy,
which includes a growing global customer base as well as higher net
investment income refl ecting improved economic conditions and
asset growth. See the individual segment sections of this MD&A for
further discussion.
Shareholders’ income from continuing operations increased 3% in
2010 compared with 2009, refl ecting strong growth in adjusted
income from operations as explained above as well as signifi cant
improvement in realized investment results, partially off set by a loss
in the GMIB business in 2010 compared with a signifi cant gain in
2009. See the Run-off Reinsurance section of the MD&A beginning
on page 55 for additional information on GMIB results.
Overview of 2009 Consolidated Results
of Operations
Adjusted income from operations increased 16% in 2009 compared
with 2008 primarily refl ecting signifi cantly improved results in the
Run-off Reinsurance segment due to a lower amount of reserve
strengthening required for the GMDB business in 2009 compared
with 2008. is result was primarily due to improved equity market
conditions in 2009. Also, in the aggregate, adjusted income from
operations from the Company’s ongoing operating segments (Health
Care, Disability and Life, and International) improved slightly in
2009 over 2008. ese favorable eff ects were partially off set by higher
unallocated costs (including interest) reported in Corporate.
Shareholders’ income from continuing operations for the year ended
December 31, 2009 was signifi cantly higher than 2008, refl ecting
improved adjusted income from operations, as explained above, as
well as the following:
•substantially improved results in the GMIB business due to
improved equity market conditions and generally higher interest
rates;
•improved realized investment results, also refl ecting better market
conditions during 2009; and
•the favorable year over year impact of the following special items as
detailed in the table above: completion of the IRS examination; the
curtailment gain on the pension plan; and the absence of litigation
charges in 2009.
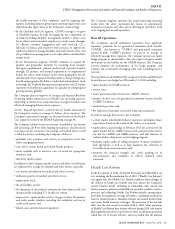
Special Items and GMIB
Management does not believe that the special items noted in the
table above are representative of the Company’s underlying results
of operations. Accordingly, the Company excluded these special
items from adjusted income from operations in order to facilitate an
understanding and comparison of results of operations and permit
analysis of trends in underlying revenue, expenses and shareholders’
income from continuing operations.
Special items for 2010 included:
•a gain resulting from the resolution of a federal income tax matter,
consisting of a $97 million release of a deferred tax valuation
allowance and $4 million of accrued interest. See Note 20 for
further information;
•a loss on the extinguishment of debt resulting from the decision of
certain holders of the Company’s 8.5% Notes due 2019 and 6.35%
Notes due 2018 to accept the Company’s tender off er to redeem
these Notes for cash. See Note 16 for further information; and
•a loss on reinsurance of the run-off workers’ compensation and
personal accident reinsurance businesses to Enstar. See Note 3 for
further information.
Special items for 2009 included a curtailment gain resulting
from the decision to freeze the pension plan (see Note 10 to the
Consolidated Financial Statements for additional information), cost
reduction charges related to the 2008 cost reduction program (see
the Introduction section of the MD&A beginning on page 33 of
this Form 10-K), and benefi ts resulting from the completion of the
2005 and 2006 IRS examinations (see Note 20 to the Consolidated
Financial Statements for additional information).
Special items for 2008 included a cost reduction charge related to
the 2008 cost reduction program (see the Introduction section of
the MD&A beginning on page 33 of this Form 10-K), a litigation
matter related to the CIGNA Pension Plan (see Note 24 to the
Consolidated Financial Statements for additional information)
reported in Corporate and charges related to certain other litigation
matters, which are reported in the Health Care segment.
e Company also excludes the results of the GMIB business
from adjusted income from operations because the fair value of
GMIB assets and liabilities must be recalculated each quarter using
updated capital market assumptions. e resulting changes in fair
value, which are reported in shareholders’ net income, are volatile
and unpredictable. See the Critical Accounting Estimates section
of the MD&A beginning on page 41 of this Form 10-K for more
information on the eff ect of capital market assumption changes on
shareholders’ net income. Because of this volatility, and since the
GMIB business is in run-off , management does not believe that its
results are meaningful in assessing underlying results of operations.
e loss for the GMIB business in 2010 primarily refl ects the impact
of declining interest rates, partially off set by favorable equity market
performance, whereas the gain in 2009 primarily refl ected increases
in interest rates combined with favorable equity market performance.
See the Run-off Reinsurance section of the MD&A beginning on
page 55 for further information on the GMIB business.
Outlook for 2011
e Company expects 2011 adjusted income from operations to be
approximately level with 2010. is outlook includes an assumption
that GMDB (also known as “VADBe”) results will be approximately
break-even for 2011, which assumes that actual experience, including
capital market performance, will be consistent with long-term reserve
assumptions. See Note 7 to the Consolidated Financial Statements and
the Critical Accounting Estimates section of this MD&A beginning on
page 41 for more information on the potential eff ect of capital market
and other assumption changes on shareholders’ net income.