Cigna 2010 Annual Report Download - page 58
Download and view the complete annual report
Please find page 58 of the 2010 Cigna annual report below. You can navigate through the pages in the report by either clicking on the pages listed below, or by using the keyword search tool below to find specific information within the annual report.-
 1
1 -
2
-
3
-
4
-
5
-
6
-
7
-
8
-
9
-
10
-
11
-
12
-
13
-
14
-
15
-
16
-
17
-
18
-
19
-
20
-
21
-
22
-
23
-
24
-
25
-
26
-
27
-
28
-
29
-
30
-
31
-
32
-
33
-
34
-
35
-
36
-
37
-
38
-
39
-
40
-
41
-
42
-
43
-
44
-
45
-
46
-
47
-
 48
48 -
 49
49 -
 50
50 -
 51
51 -
 52
52 -
 53
53 -
 54
54 -
 55
55 -
 56
56 -
 57
57 -
 58
58 -
 59
59 -
 60
60 -
 61
61 -
 62
62 -
 63
63 -
 64
64 -
 65
65 -
 66
66 -
 67
67 -
 68
68 -
69
-
70
-
71
-
72
-
73
-
74
-
75
-
76
-
77
-
78
-
79
-
80
-
81
-
82
-
83
-
84
-
85
-
86
-
87
-
88
-
89
-
90
-
91
-
92
-
93
-
94
-
95
-
96
-
97
-
98
-
99
-
100
-
101
-
102
-
103
-
104
-
105
-
106
-
107
-
108
-
109
-
110
-
111
-
112
-
113
-
114
-
115
-
116
-
117
-
118
-
119
-
120
-
121
-
122
-
123
-
124
-
125
-
126
-
127
-
128
-
129
-
130
-
131
-
132
-
133
-
134
-
135
-
136
-
137
-
138
-
139
-
140
-
141
-
142
-
143
-
144
-
145
-
146
-
147
-
148
-
149
-
150
-
151
-
152
-
153
-
154
-
155
-
156
-
157
-
158
-
159
-
160
-
161
-
162
-
163
-
164
-
165
-
166
-
167
-
168
-
169
-
170
-
171
-
172
 |
 |

CIGNA CORPORATION 2010 Form 10K
38
PART II
ITEM 7 Management’s Discussion and Analysis of Financial Condition and Results of Operations
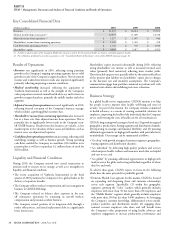
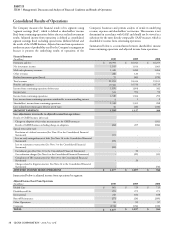
Consolidated Results of Operations
e Company measures the fi nancial results of its segments using
“segment earnings (loss)”, which is defi ned as shareholders’ income
(loss) from continuing operations before after-tax realized investment
results. Adjusted income from operations is defi ned as consolidated
segment earnings (loss) excluding special items (defi ned below) and
the results of the GMIB business. Adjusted income from operations is
another measure of profi tability used by the Company’s management
because it presents the underlying results of operations of the
Company’s businesses and permits analysis of trends in underlying
revenue, expenses and shareholders’ net income. is measure is not
determined in accordance with GAAP and should not be viewed as a
substitute for the most directly comparable GAAP measure, which is
shareholders’ income from continuing operations.
Summarized below is a reconciliation between shareholders’ income
from continuing operations and adjusted income from operations.
Financial Summary
(In millions)
2010 2009 2008
Premiums and fees $ 18,393 $ 16,041 $ 16,253
Net investment income 1,105 1,014 1,063
Mail order pharmacy revenues 1,420 1,282 1,204
Other revenues 260 120 751
Realized investment gains (losses) 75 (43) (170)
Total revenues 21,253 18,414 19,101
Benefi ts and expenses 19,383 16,516 18,719
Income from continuing operations before taxes 1,870 1,898 382
Income taxes 521 594 92
Income from continuing operations 1,349 1,304 290
Less: income from continuing operations attributable to noncontrolling interest 432
Shareholders’ income from continuing operations 1,345 1,301 288
Less: realized investment gains (losses), net of taxes 50 (26) (110)
SEGMENT EARNINGS 1,295 1,327 398
Less: adjustments to reconcile to adjusted income from operations:
Results of GMIB business (after-tax):
Charge on adoption of fair value measurements for GMIB contracts - - (131)
Results of GMIB business excluding charge on adoption (24) 209 (306)
Special items (after-tax):
Resolution of a federal tax matter (See Note 20 to the Consolidated Financial
Statements) 101--
Loss on early extinguishment of debt (See Note 16 to the Consolidated Financial
Statements) (39) - -
Loss on reinsurance transaction (See Note 3 to the Consolidated Financial
Statements) (20) - -
Curtailment gain (See Note 10 to the Consolidated Financial Statements) - 30 -
Cost reduction charges (See Note 6 to the Consolidated Financial Statements) - (29) (35)
Completion of IRS examination (See Note 20 to the Consolidated Financial
Statements) -20 -
Charges related to litigation matters (See Note 24 to the Consolidated Financial
Statements) - - (76)
ADJUSTED INCOME FROM OPERATIONS $ 1,277 $ 1,097 $ 946
Summarized below is adjusted income from operations by segment:
Adjusted Income (Loss) From Operations
(In millions)
2010 2009 2008
Health Care $ 861 $ 729 $ 715
Disability and Life 291 279 275
International 243 182 188
Run-off Reinsurance (27) (24) (209)
Other Operations 85 85 87
Corporate (176) (154) (110)
TOTAL $ 1,277 $ 1,097 $ 946