Cigna 2010 Annual Report Download - page 60
Download and view the complete annual report
Please find page 60 of the 2010 Cigna annual report below. You can navigate through the pages in the report by either clicking on the pages listed below, or by using the keyword search tool below to find specific information within the annual report.-
 1
1 -
2
-
3
-
4
-
5
-
6
-
7
-
8
-
9
-
10
-
11
-
12
-
13
-
14
-
15
-
16
-
17
-
18
-
19
-
20
-
21
-
22
-
23
-
24
-
25
-
26
-
27
-
28
-
29
-
30
-
31
-
32
-
33
-
34
-
35
-
36
-
37
-
38
-
39
-
40
-
41
-
42
-
43
-
44
-
45
-
46
-
47
-
48
-
49
-
 50
50 -
 51
51 -
 52
52 -
 53
53 -
 54
54 -
 55
55 -
 56
56 -
 57
57 -
 58
58 -
 59
59 -
 60
60 -
 61
61 -
 62
62 -
 63
63 -
 64
64 -
 65
65 -
 66
66 -
 67
67 -
 68
68 -
 69
69 -
 70
70 -
71
-
72
-
73
-
74
-
75
-
76
-
77
-
78
-
79
-
80
-
81
-
82
-
83
-
84
-
85
-
86
-
87
-
88
-
89
-
90
-
91
-
92
-
93
-
94
-
95
-
96
-
97
-
98
-
99
-
100
-
101
-
102
-
103
-
104
-
105
-
106
-
107
-
108
-
109
-
110
-
111
-
112
-
113
-
114
-
115
-
116
-
117
-
118
-
119
-
120
-
121
-
122
-
123
-
124
-
125
-
126
-
127
-
128
-
129
-
130
-
131
-
132
-
133
-
134
-
135
-
136
-
137
-
138
-
139
-
140
-
141
-
142
-
143
-
144
-
145
-
146
-
147
-
148
-
149
-
150
-
151
-
152
-
153
-
154
-
155
-
156
-
157
-
158
-
159
-
160
-
161
-
162
-
163
-
164
-
165
-
166
-
167
-
168
-
169
-
170
-
171
-
172
 |
 |
CIGNA CORPORATION 2010 Form 10K
40
PART II
ITEM 7 Management’s Discussion and Analysis of Financial Condition and Results of Operations
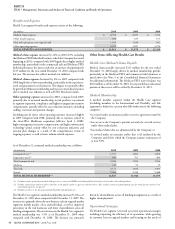
Information is not available for management to reasonably estimate
the future results of the GMIB business or realized investment results
due in part to interest rate and stock market volatility and other
internal and external factors. In addition, the Company is not able to
identify or reasonably estimate the fi nancial impact of special items in
2011 however they may include potential adjustments associated with
cost reduction, litigation, tax and assessment-related matters.
e Company’s outlook for 2011 is subject to the factors cited
above and in the Cautionary Statement beginning on page 70
of this Form 10-K and the sensitivities discussed in the Critical
Accounting Estimates section of the MD&A beginning on page 41
of this Form 10-K. If unfavorable equity market and interest rate
movements occur, the Company could experience losses related to
investment impairments and the GMIB and GMDB businesses.
ese losses could adversely impact the Company’s consolidated
results of operations and fi nancial condition by potentially reducing
the capital of the Company’s insurance subsidiaries and reducing
their dividend-paying capabilities.
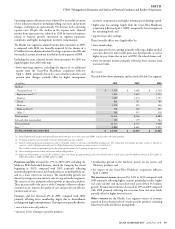
Revenues
Total revenues increased by 15% in 2010, compared with 2009,
and decreased by 4% in 2009 compared with 2008. Changes in the
components of total revenue are described in more detail below.
Premiums and Fees
Premiums and fees increased by 15% in 2010, compared with 2009,
primarily refl ecting membership growth in the Health Care segment’s
risk businesses as well as growth in the International segment.
Premiums and fees increased by 10% in 2010 compared with 2009
after excluding the Medicare Private Fee for Service (“Medicare
PFFS”) Individual business, from which the Company has exited
beginning in 2011.
Premiums and fees decreased by 1% in 2009, compared with 2008,
primarily refl ecting membership declines in Health Care resulting
from higher unemployment and the unfavorable eff ect of foreign
currency translation in International, off set by the absence of
premium and fees from Great West Healthcare in the fi rst quarter of
2008 since this business was acquired April 1, 2008.
Net Investment Income
Net investment income increased by 9% in 2010, compared with
2009, primarily refl ecting improved results from security partnerships
and real estate investments and higher assets due to business growth,
partially off set by lower reinvestment yields.
Net investment income decreased by 5% in 2009, compared with
2008, primarily refl ecting lower income from real estate investments
and security partnerships, unfavorable foreign exchange rates and
lower investment yields, partially off set by higher invested assets due
to business growth.
Mail Order Pharmacy Revenues
Mail order pharmacy revenues increased by 11% in 2010, compared
with 2009, primarily refl ecting increases in volume and, to a lesser
extent, price increases and by 6% in 2009, compared with 2008,
primarily due to price increases.
Other Revenues
Other revenues include the impact of futures contracts associated
with the GMDB equity hedge program. Losses on futures contracts
refl ect stock market gains, whereas gains refl ect stock market losses.
e Company reported losses associated with the GMDB equity
hedge program of $157 million in 2010 and $282 million in 2009
compared with gains of $333 million in 2008. Excluding the impact
of the futures contracts associated with the GMDB equity hedge
program, Other revenues increased 4% in 2010, compared with
2009 primarily refl ecting the pre-tax gain on the sale of the workers’
compensation and case management business of $18 million.
Excluding the impact of the futures contracts associated with the
GMDB equity hedge program, Other revenues decreased 4% in 2009,
compared with 2008, primarily refl ecting declines in amortization of
deferred gains on the sales of the retirement benefi ts and individual
life insurance and annuity business.
Realized Investment Results
Realized investment results in 2010 were signifi cantly higher than in
2009 primarily due to:
•lower impairments on fi xed maturities and real estate funds in 2010;
•increased prepayment fees on fi xed maturities received in 2010 as
a result of favorable market conditions and issuer specifi c business
circumstances; and
•gains on sales of real estate held in joint ventures and other
investments in 2010.
ese favorable eff ects were partially off set by an increase in
commercial mortgage loan impairments recorded in 2010, refl ecting
continued weakness in the commercial real estate market.
Realized investment results in 2009 were signifi cantly improved
compared to 2008, primarily due to:
•lower asset write-downs on fi xed maturities largely refl ecting
improved market conditions;
•gains on sales of fi xed maturities and equities in 2009 compared
with losses in 2008; and
•gains on hybrid securities in 2009 compared with losses in 2008
(changes in fair value for these securities are reported in realized
investment results).
ese favorable eff ects were partially off set by higher impairments of
investments in real estate entities and commercial mortgage loans in
2009 due to the impact of the continued weak economic environment
on the commercial real estate market and the absence of signifi cant
gains on the sales of real estate ventures reported during 2008.
See Note 15 to the Consolidated Financial Statements for additional
information.