Cigna 2010 Annual Report Download - page 74
Download and view the complete annual report
Please find page 74 of the 2010 Cigna annual report below. You can navigate through the pages in the report by either clicking on the pages listed below, or by using the keyword search tool below to find specific information within the annual report.-
 1
1 -
2
-
3
-
4
-
5
-
6
-
7
-
8
-
9
-
10
-
11
-
12
-
13
-
14
-
15
-
16
-
17
-
18
-
19
-
20
-
21
-
22
-
23
-
24
-
25
-
26
-
27
-
28
-
29
-
30
-
31
-
32
-
33
-
34
-
35
-
36
-
37
-
38
-
39
-
40
-
41
-
42
-
43
-
44
-
45
-
46
-
47
-
48
-
49
-
50
-
51
-
52
-
53
-
54
-
55
-
56
-
57
-
58
-
59
-
60
-
61
-
62
-
63
-
 64
64 -
 65
65 -
 66
66 -
 67
67 -
 68
68 -
 69
69 -
 70
70 -
 71
71 -
 72
72 -
 73
73 -
 74
74 -
 75
75 -
 76
76 -
 77
77 -
 78
78 -
 79
79 -
 80
80 -
 81
81 -
 82
82 -
 83
83 -
 84
84 -
85
-
86
-
87
-
88
-
89
-
90
-
91
-
92
-
93
-
94
-
95
-
96
-
97
-
98
-
99
-
100
-
101
-
102
-
103
-
104
-
105
-
106
-
107
-
108
-
109
-
110
-
111
-
112
-
113
-
114
-
115
-
116
-
117
-
118
-
119
-
120
-
121
-
122
-
123
-
124
-
125
-
126
-
127
-
128
-
129
-
130
-
131
-
132
-
133
-
134
-
135
-
136
-
137
-
138
-
139
-
140
-
141
-
142
-
143
-
144
-
145
-
146
-
147
-
148
-
149
-
150
-
151
-
152
-
153
-
154
-
155
-
156
-
157
-
158
-
159
-
160
-
161
-
162
-
163
-
164
-
165
-
166
-
167
-
168
-
169
-
170
-
171
-
172
 |
 |

CIGNA CORPORATION 2010 Form 10K
54
PART II
ITEM 7 Management’s Discussion and Analysis of Financial Condition and Results of Operations
International Segment
Segment Description
e International segment includes supplemental health, life and
accident insurance products and international health care products
and services, including those off ered to expatriate employees of
multinational corporations and other organizations.
e key factors for this segment are:
•premium growth, including new business and customer retention;
•benefi ts expense as a percentage of earned premium (loss ratio);
•operating expense as a percentage of earned premium (expense
ratio); and
•impact of foreign currency movements.
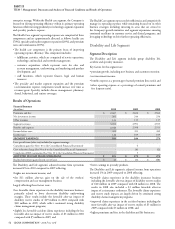
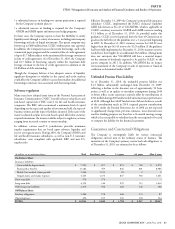
Results of Operations
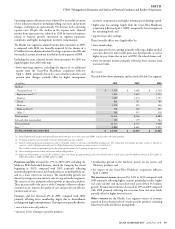
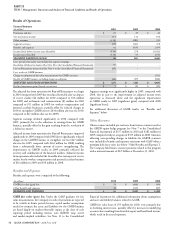
Financial Summary
(In millions)
2010 2009 2008
Premiums and fees $ 2,268 $ 1,882 $ 1,870
Net investment income 82 69 79
Other revenues 31 22 18
Segment revenues 2,381 1,973 1,967
Benefi ts and expenses 2,039 1,717 1,679
Income before taxes 342 256 288
Income taxes 95 70 104
Income attributable to noncontrolling interest 4 3 2
SEGMENT EARNINGS 243 183 182
Less: special items (after-tax) included in segment earnings:
Cost reduction charge (See Note 6 to the Consolidated Financial Statements) - (1) (6)
Curtailment gain (See Note 10 to the Consolidated Financial Statements) - 1 -
Completion of IRS examination (See Note 20 to the Consolidated Financial Statements) - 1 -
ADJUSTED INCOME FROM OPERATIONS $ 243 $ 182 $ 188
Impact of foreign currency movements using 2009 rates $ 13
Impact of foreign currency movements using 2008 rates $ 11 $ (15)
Impact of permanent investment in overseas earnings:
Implementation eff ect $ 5 $ 14 $ -
Eff ect of recording taxes at the tax rates of respective foreign jurisdictions 25 8-
TOTAL $30 $22 $
Realized investment gains (losses), net of taxes $ 2 $ 2 $ (3)
Excluding the impact of the tax adjustments discussed below and
foreign currency movements (presented in the table above), the
International segment’s adjusted income from operations increased
25% for 2010, compared with 2009. e increase was primarily due
to strong revenue growth and higher persistency in the supplemental
health, life and accident insurance business, particularly in South
Korea, as well as favorable loss ratios and membership growth in
the expatriate employee benefi ts business and higher net investment
income, partially off set by higher administrative expenses. Both
businesses continue to deliver attractive margins.
Excluding the impact of the tax adjustments discussed below and
foreign currency movements (presented in the table above), the
International segment’s adjusted income from operations decreased
7% for 2009, compared with 2008. e decrease was primarily
driven by unfavorable claims experience in the supplemental health,
life and accident insurance business and the expatriate employee
benefi ts business. e unfavorable eff ects were partially off set by
revenue growth and competitively strong margins in both businesses.
During the fi rst quarter of 2010, the Company’s International
segment implemented a capital management strategy to permanently
invest the earnings of its Hong Kong operation overseas. Income
taxes for this operation, and the South Korean operation that
implemented a similar strategy in the second quarter of 2009, are
recorded at the tax rate of the respective foreign jurisdiction. See the
Financial Summary table for the eff ect of these capital management
strategies on International’s adjusted income from operations for each
applicable period. e increase in the eff ect of recording taxes at the
tax rates of respective foreign jurisdictions in 2010 primarily refl ects
higher pre-tax earnings in South Korea and, to a lesser extent, the
addition of Hong Kong in 2010.
roughout this discussion, the impact of foreign currency
movements was calculated by comparing the reported results to what
the results would have been had the exchange rates remained constant
with the prior year’s comparable period exchange rates. e favorable
impact in 2010 using 2009 rates, as well as the unfavorable change in
2009 using 2008 rates, primarily refl ects the movement between the
U.S. dollar and the South Korean won.