Cigna 2010 Annual Report Download - page 131
Download and view the complete annual report
Please find page 131 of the 2010 Cigna annual report below. You can navigate through the pages in the report by either clicking on the pages listed below, or by using the keyword search tool below to find specific information within the annual report.-
 1
1 -
2
-
3
-
4
-
5
-
6
-
7
-
8
-
9
-
10
-
11
-
12
-
13
-
14
-
15
-
16
-
17
-
18
-
19
-
20
-
21
-
22
-
23
-
24
-
25
-
26
-
27
-
28
-
29
-
30
-
31
-
32
-
33
-
34
-
35
-
36
-
37
-
38
-
39
-
40
-
41
-
42
-
43
-
44
-
45
-
46
-
47
-
48
-
49
-
50
-
51
-
52
-
53
-
54
-
55
-
56
-
57
-
58
-
59
-
60
-
61
-
62
-
63
-
64
-
65
-
66
-
67
-
68
-
69
-
70
-
71
-
72
-
73
-
74
-
75
-
76
-
77
-
78
-
79
-
80
-
81
-
82
-
83
-
84
-
85
-
86
-
87
-
88
-
89
-
90
-
91
-
92
-
93
-
94
-
95
-
96
-
97
-
98
-
99
-
100
-
101
-
102
-
103
-
104
-
105
-
106
-
107
-
108
-
109
-
110
-
111
-
112
-
113
-
114
-
115
-
116
-
117
-
118
-
119
-
120
-
 121
121 -
 122
122 -
 123
123 -
 124
124 -
 125
125 -
 126
126 -
 127
127 -
 128
128 -
 129
129 -
 130
130 -
 131
131 -
 132
132 -
 133
133 -
 134
134 -
 135
135 -
 136
136 -
 137
137 -
 138
138 -
 139
139 -
 140
140 -
 141
141 -
142
-
143
-
144
-
145
-
146
-
147
-
148
-
149
-
150
-
151
-
152
-
153
-
154
-
155
-
156
-
157
-
158
-
159
-
160
-
161
-
162
-
163
-
164
-
165
-
166
-
167
-
168
-
169
-
170
-
171
-
172
 |
 |

CIGNA CORPORATION 2010 Form 10K 111
PART II
ITEM 8 Financial Statements and Supplementary Data
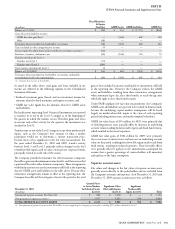
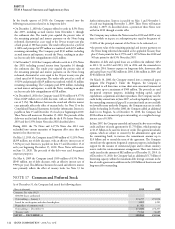
Included in pre-tax realized investment gains (losses) above were asset
write-downs and changes in valuation reserves as follows:
(in millions)
2010 2009 2008
Credit related (1) $38 $93 $67
Other (2) 1 13 150
TOTAL3 $ 39 $ 106 $ 217
(1) Credit-related losses include other-than-temporary declines in fair value of fixed maturities and equity securities, and impairments of commercial mortgage loans and real estate
entities. The amount related to credit losses on fixed maturities for which a portion of the impairment was recognized in other comprehensive income was not significant.
(2) Prior to adoption of new GAAP guidance for other-than-temporary impairments on April 1, 2009, other primarily represented the impact of rising market yields on investments where
the Company could not demonstrate the intent and ability to hold until recovery.
(3) Other-than-temporary impairments on fixed maturities in 2010 were not significant. Other-than-temporary impairments on fixed maturities of $47 million in 2009 and
$213 million in 2008 are included in both the credit related and other categories above.
e Company recognized pre-tax gains of $7 million in 2010 and
$13 million in 2009, compared with pre-tax losses of $31 million in
2008 on hybrid securities.
Realized investment losses in 2009 in other investments, including
derivatives primarily represent impairments of real estate entities.
In 2008, gains primarily represented gains on the sales of real estate
properties held in joint ventures.
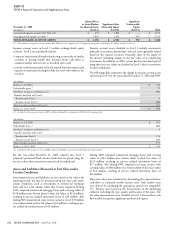
Realized investment gains and (losses) that are not refl ected in the
Company’s revenues for the years ended December 31 were as follows:
(In millions)
2010 2009 2008
Separate accounts $ 191 $ (25) $ (146)
Investment gains required to adjust future policy benefi ts for the run-off settlement
annuity business $18 $51 $ 8
Sales information for available-for-sale fi xed maturities and equity
securities, for the years ended December 31 were as follows:
(In millions)
2010 2009 2008
Proceeds from sales $ 826 $ 949 $ 1,465
Gross gains on sales $ 46 $ 51 $ 13
Gross losses on sales $ (3) $ (9) $ (53)
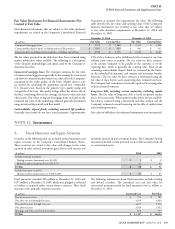
NOTE 16 Debt
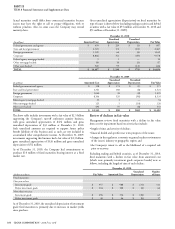
(In millions)
2010 2009
Short-term:
Commercial paper $ 100 $ 100
Current maturities of long-term debt 452 4
TOTAL SHORTTERM DEBT $ 552 $ 104
Long-term:
Uncollateralized debt:
7% Notes due 2011 $ — $ 222
6.375% Notes due 2011 — 226
5.375% Notes due 2017 250 250
6.35% Notes due 2018 131 300
8.5% Notes due 2019 251 349
4.375% Notes due 2020 249 —
5.125% Notes due 2020 299 —
6.37% Notes due 2021 78 78
7.65% Notes due 2023 100 100
8.3% Notes due 2023 17 17
7.875% Debentures due 2027 300 300
8.3% Step Down Notes due 2033 83 83
6.15% Notes due 2036 500 500
Other 30 11
TOTAL LONGTERM DEBT $ 2,288 $ 2,436