Cigna 2010 Annual Report Download - page 115
Download and view the complete annual report
Please find page 115 of the 2010 Cigna annual report below. You can navigate through the pages in the report by either clicking on the pages listed below, or by using the keyword search tool below to find specific information within the annual report.-
 1
1 -
2
-
3
-
4
-
5
-
6
-
7
-
8
-
9
-
10
-
11
-
12
-
13
-
14
-
15
-
16
-
17
-
18
-
19
-
20
-
21
-
22
-
23
-
24
-
25
-
26
-
27
-
28
-
29
-
30
-
31
-
32
-
33
-
34
-
35
-
36
-
37
-
38
-
39
-
40
-
41
-
42
-
43
-
44
-
45
-
46
-
47
-
48
-
49
-
50
-
51
-
52
-
53
-
54
-
55
-
56
-
57
-
58
-
59
-
60
-
61
-
62
-
63
-
64
-
65
-
66
-
67
-
68
-
69
-
70
-
71
-
72
-
73
-
74
-
75
-
76
-
77
-
78
-
79
-
80
-
81
-
82
-
83
-
84
-
85
-
86
-
87
-
88
-
89
-
90
-
91
-
92
-
93
-
94
-
95
-
96
-
97
-
98
-
99
-
100
-
101
-
102
-
103
-
104
-
 105
105 -
 106
106 -
 107
107 -
 108
108 -
 109
109 -
 110
110 -
 111
111 -
 112
112 -
 113
113 -
 114
114 -
 115
115 -
 116
116 -
 117
117 -
 118
118 -
 119
119 -
 120
120 -
 121
121 -
 122
122 -
 123
123 -
 124
124 -
 125
125 -
126
-
127
-
128
-
129
-
130
-
131
-
132
-
133
-
134
-
135
-
136
-
137
-
138
-
139
-
140
-
141
-
142
-
143
-
144
-
145
-
146
-
147
-
148
-
149
-
150
-
151
-
152
-
153
-
154
-
155
-
156
-
157
-
158
-
159
-
160
-
161
-
162
-
163
-
164
-
165
-
166
-
167
-
168
-
169
-
170
-
171
-
172
 |
 |

CIGNA CORPORATION 2010 Form 10K 95
PART II
ITEM 8 Financial Statements and Supplementary Data
models are used to determine these prices. ese models calculate fair
values by discounting future cash fl ows at estimated market interest
rates. Such market rates are derived by calculating the appropriate
spreads over comparable U.S. Treasury securities, based on the credit
quality, industry and structure of the asset.
Plan assets classifi ed in Level 3 include securities partnerships
and equity real estate generally valued based on the pension plan’s
ownership share of the equity of the investee including changes
in the fair values of its underlying investments. In addition, as of
December 31, 2009, investments in pooled separate accounts
principally invested in equity real estate and fi xed income funds that
are priced using the net asset value are classifi ed in Level 3 due to
restrictions on withdrawal.
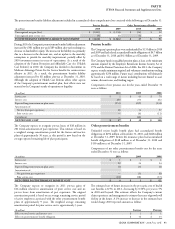
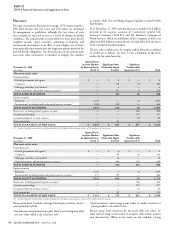
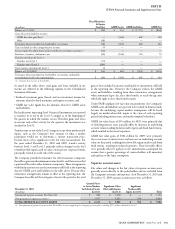
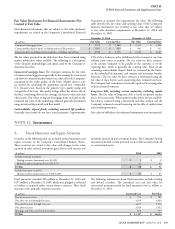
e following table summarizes the changes in pension plan assets
classifi ed in Level 3 for the years ended December 31, 2010 and
December 31, 2009. Actual return on plan assets in this table may
include changes in fair value that are attributable to both observable
and unobservable inputs.
(In millions)
Fixed Maturities Equity
Securities Mortgage Loans
&Real Estate Securities
Partnerships
Guaranteed
Deposit Account
Contract Total
Balance at January 1, 2010 $ 144 $ 23 $ 160 $ 257 $ 29 $ 613
Actual return on plan assets:
Assets still held at the reporting date (14) (1) 16 53 2 56
Assets sold during the period 14————14
Total actual return on plan assets — (1) 16 53 2 70
Purchases, sales, settlements, net (121) 2 64 37 (7) (25)
Transfers into Level 3 6———— 6
Transfers out of Level 3 (3) (4)———(7)
Balance at December 31, 2010 $ 26 $ 20 $ 240 $ 347 $ 24 $ 657
(In millions)
Fixed Maturities Equity
Securities Real Estate Securities
Partnerships
Guaranteed
Deposit Account
Contract Total
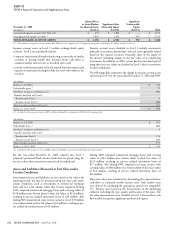
Balance at January 1, 2009 $ 31 $ 14 $ 208 $ 264 $ 32 $ 549
Actual return on plan assets:
Assets still held at the reporting date 8 — (104) (31) 8 (119)
Assets sold during the period 5 — — — — 5
Total actual return on plan assets 13 — (104) (31) 8 (114)
Purchases, sales, settlements, net (75) 9 56 24 (11) 3
Transfers into Level 3 175 — — — — 175
Balance at December 31, 2009 $ 144 $ 23 $ 160 $ 257 $ 29 $ 613
e assets related to other postretirement benefi t plans are invested
in deposit funds with interest credited based on fi xed income
investments in the general account of CGLIC. As there are signifi cant
unobservable inputs used in determining the fair value of these assets,
they are classifi ed as Level 3. During 2010, these assets earned a
return of $1 million, off set by a net withdrawal from the fund of
$2 million, while during 2009, they earned a return of $2 million,
off set by a net withdrawal of $2 million.
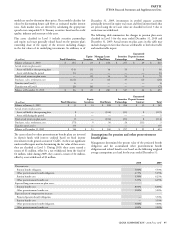
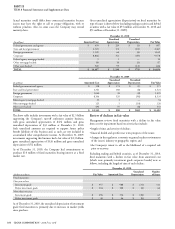
Assumptions for pension and other postretirement
benefi t plans
Management determined the present value of the projected benefi t
obligation and the accumulated other postretirement benefi t
obligation and related benefi t costs based on the following weighted
average assumptions as of and for the years ended December 31:
2010 2009
Discount rate:
Pension benefi t obligation 5.00% 5.50%
Other postretirement benefi t obligation 4.75% 5.25%
Pension benefi t cost 5.50% 6.25%
Other postretirement benefi t cost 5.25% 6.25%
Expected long-term return on plan assets:
Pension benefi t cost 8.00% 8.00%
Other postretirement benefi t cost 5.00% 5.00%
Expected rate of compensation increase:
Projected pension benefi t obligation — 3.50%
Pension benefi t cost — 3.50%
Other postretirement benefi t obligation 3.00% 3.00%
Other postretirement benefi t cost 3.00% 3.00%