Chevron 2008 Annual Report Download - page 99
Download and view the complete annual report
Please find page 99 of the 2008 Chevron annual report below. You can navigate through the pages in the report by either clicking on the pages listed below, or by using the keyword search tool below to find specific information within the annual report.-
 1
1 -
2
-
3
-
4
-
5
-
6
-
7
-
8
-
9
-
10
-
11
-
12
-
13
-
14
-
15
-
16
-
17
-
18
-
19
-
20
-
21
-
22
-
23
-
24
-
25
-
26
-
27
-
28
-
29
-
30
-
31
-
32
-
33
-
34
-
35
-
36
-
37
-
38
-
39
-
40
-
41
-
42
-
43
-
44
-
45
-
46
-
47
-
48
-
49
-
50
-
51
-
52
-
53
-
54
-
55
-
56
-
57
-
58
-
59
-
60
-
61
-
62
-
63
-
64
-
65
-
66
-
67
-
68
-
69
-
70
-
71
-
72
-
73
-
74
-
75
-
76
-
77
-
78
-
79
-
80
-
81
-
82
-
83
-
84
-
85
-
86
-
87
-
88
-
 89
89 -
 90
90 -
 91
91 -
 92
92 -
 93
93 -
 94
94 -
 95
95 -
 96
96 -
 97
97 -
 98
98 -
 99
99 -
 100
100 -
 101
101 -
 102
102 -
 103
103 -
 104
104 -
 105
105 -
 106
106 -
 107
107 -
 108
108 -
 109
109 -
110
-
111
-
112
 |
 |

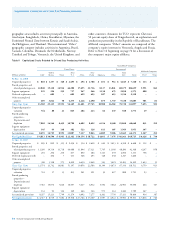
Chevron Corporation 2008 Annual Report 97
Consolidated Companies
United States International
Gulf of Total Asia- Total Affiliated Companies
Millions of dollars Calif. Mexico Other U.S. Africa Pacific Indonesia Other Int’l. Total TCO Other
Year Ended Dec. 31, 2006
Revenues from net
production
Sales $ 308 $ 1,845 $ 2,976 $ 5,129 $ 2,377 $ 4,938 $ 1,001 $ 2,814 $ 11,130 $ 16,259 $ 2,861 $ 598
Transfers 4,072 2,317 2,046 8,435 5,264 4,084 2,211 2,848 14,407 22,842 – –
Total 4,380 4,162 5,022 13,564 7,641 9,022 3,212 5,662 25,537 39,101 2,861 598
Production expenses
excluding taxes (889) (765) (1,057) (2,711) (640) (740) (728) (664) (2,772) (5,483) (202) (42)
Taxes other than on
income (84) (57) (442) (583) (57) (231) (1) (60) (349) (932) (28) (6)
Proved producing properties:
Depreciation and depletion (275) (1,096) (763) (2,134) (579) (1,475) (666) (703) (3,423) (5,557) (114) (33)
Accretion expense2 (11) (80) (39) (130) (26) (30) (23) (49) (128) (258) (1) –
Exploration expenses – (407) (24) (431) (296) (209) (110) (318) (933) (1,364) (25) –
Unproved properties
valuation (3) (73) (8) (84) (28) (15) (14) (27) (84) (168) – –
Other income (expense)3 1 (732) 254 (477) (435) (475) 50 385 (475) (952) 8 (50)
Results before
income taxes 3,119 952 2,943 7,014 5,580 5,847 1,720 4,226 17,373 24,387 2,499 467
Income tax expense (1,169) (357) (1,103) (2,629) (4,740) (3,224) (793) (2,151) (10,908) (13,537) (750) (174)
Results of Producing
Operations $ 1,950 $ 595 $ 1,840 $ 4,385 $ 840 $ 2,623 $ 927 $ 2,075 $ 6,465 $ 10,850 $ 1,749 $ 293
1 The value of owned production consumed in operations as fuel has been eliminated from revenues and production expenses, and the related volumes have been deducted from net
production in calculating the unit average sales price and production cost. This has no effect on the results of producing operations.
2 Represents accretion of ARO liability. Refer to Note 24, “Asset Retirement Obligations,” beginning on page 89.
3 Includes foreign currency gains and losses, gains and losses on property dispositions, and income from operating and technical service agreements.
Table III Results of Operations for Oil and
Gas Producing Activities1 – Continued