Chevron 2008 Annual Report Download - page 36
Download and view the complete annual report
Please find page 36 of the 2008 Chevron annual report below. You can navigate through the pages in the report by either clicking on the pages listed below, or by using the keyword search tool below to find specific information within the annual report.-
 1
1 -
2
-
3
-
4
-
5
-
6
-
7
-
8
-
9
-
10
-
11
-
12
-
13
-
14
-
15
-
16
-
17
-
18
-
19
-
20
-
21
-
22
-
23
-
24
-
25
-
 26
26 -
 27
27 -
 28
28 -
 29
29 -
 30
30 -
 31
31 -
 32
32 -
 33
33 -
 34
34 -
 35
35 -
 36
36 -
 37
37 -
 38
38 -
 39
39 -
 40
40 -
 41
41 -
 42
42 -
 43
43 -
 44
44 -
 45
45 -
 46
46 -
47
-
48
-
49
-
50
-
51
-
52
-
53
-
54
-
55
-
56
-
57
-
58
-
59
-
60
-
61
-
62
-
63
-
64
-
65
-
66
-
67
-
68
-
69
-
70
-
71
-
72
-
73
-
74
-
75
-
76
-
77
-
78
-
79
-
80
-
81
-
82
-
83
-
84
-
85
-
86
-
87
-
88
-
89
-
90
-
91
-
92
-
93
-
94
-
95
-
96
-
97
-
98
-
99
-
100
-
101
-
102
-
103
-
104
-
105
-
106
-
107
-
108
-
109
-
110
-
111
-
112
 |
 |

34 Chevron Corporation 2008 Annual Report
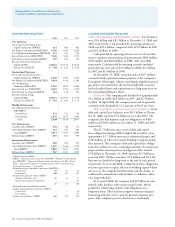
Key Financial Results
Millions of dollars, except per-share amounts 2008 2007 2006
Net Income $ 23,931 $ 18,688 $ 17,138
Per Share Amounts:
Net Income – Basic $ 11.74 $ 8.83 $ 7.84
– Diluted $ 11.67 $ 8.77 $ 7.80
Dividends $ 2.53 $ 2.26 $ 2.01
Sales and Other
Operating Revenues $ 264,958 $ 214,091 $ 204,892
Return on:
Average Capital Employed 26.6% 23.1% 22.6%
Average Stockholders’ Equity 29.2% 25.6% 26.0%
Income by Major Operating Area
Millions of dollars 2008 2007 2006
Upstream – Exploration and Production
United States $ 7,126 $ 4,532 $ 4,270
International 14,584 10,284 8,872
Total Upstream 21,710 14,816 13,142
Downstream – Refining, Marketing
and Transportation
United States 1,369 966 1,938
International 2,060 2,536 2,035
Total Downstream 3,429 3,502 3,973
Chemicals 182 396 539
All Other (1,390) (26) (516)
Net Income* $ 23,931 $ 18,688 $ 17,138
*Includes Foreign Currency Effects: $ 862 $ (352) $ (219)
Refer to the “Results of Operations” section beginning
on page 38 for a discussion of financial results by major
operating area for the three years ending December 31, 2008.
Business Environment and Outlook
Chevron is a global energy company with significant busi-
ness activities in the following countries: Angola, Argentina,
Australia, Azerbaijan, Bangladesh, Brazil, Cambodia, Canada,
Chad, China, Colombia, Democratic Republic of the Congo,
Denmark, France, India, Indonesia, Kazakhstan, Myanmar,
the Netherlands, Nigeria, Norway, the Partitioned Neutral
Zone between Saudi Arabia and Kuwait, the Philippines,
Qatar, Republic of the Congo, Singapore, South Africa, South
Korea, Thailand, Trinidad and Tobago, the United Kingdom,
the United States, Venezuela, and Vietnam.
Earnings of the company depend largely on the profit-
ability of its upstream (exploration and production) and
downstream (refining, marketing and transportation) busi-
ness segments. The single biggest factor that affects the
results of operations for both segments is movement in the
price of crude oil. In the downstream business, crude oil is
the largest cost component of refined products. The overall
trend in earnings is typically less affected by results from the
company’s chemicals business and other activities and invest-
ments. Earnings for the company in any period may also be
influenced by events or transactions that are infrequent and/
or unusual in nature.
In recent years and through most of 2008, Chevron and
the oil and gas industry at large experienced an increase in
certain costs that exceeded the general trend of inflation in
many areas of the world. This increase in costs affected the
company’s operating expenses and capital programs for all
business segments, but particularly for upstream. These cost
pressures began to soften somewhat in late 2008. As the price
of crude oil dropped precipitously from a record high in mid-
year, the demand for some goods and services in the industry
began to slacken. This cost trend is expected to continue
during 2009 if crude-oil prices do not significantly rebound.
(Refer to the “Upstream” section on next page for a discus-
sion of the trend in crude-oil prices.)
The company’s operations, especially upstream, can also
be affected by changing economic, regulatory and political
environments in the various countries in which it operates,
including the United States. Civil unrest, acts of violence or
strained relations between a government and the company or
other governments may impact the company’s operations or
investments. Those developments have at times significantly
affected the company’s operations and results and are care-
fully considered by management when evaluating the level
of current and future activity in such countries.
To sustain its long-term competitive position in the
upstream business, the company must develop and replenish
an inventory of projects that offer adequate financial returns
for the investment required. Identifying promising areas for
exploration, acquiring the necessary rights to explore for and
to produce crude oil and natural gas, drilling successfully,
and handling the many technical and operational details in
a safe and cost-effective manner are all important factors in
this effort. Projects often require long lead times and large
capital commitments. From time to time, certain governments
have sought to renegotiate contracts or impose additional
costs on the company. Governments may attempt to do so
in the future. The company will continue to monitor these
developments, take them into account in evaluating future
investment opportunities, and otherwise seek to mitigate any
risks to the company’s current operations or future prospects.
The company also continually evaluates opportunities
to dispose of assets that are not expected to provide sufficient
long-term value or to acquire assets or operations complemen-
tary to its asset base to help augment the company’s growth.
Refer to the “Results of Operations” section beginning on
page 38 for discussions of net gains on asset sales during
2008. Asset dispositions and restructurings may occur in
future periods and could result in significant gains or losses.
Management’s Discussion and Analysis of
Financial Condition and Results of Operations