Chevron 2008 Annual Report Download - page 69
Download and view the complete annual report
Please find page 69 of the 2008 Chevron annual report below. You can navigate through the pages in the report by either clicking on the pages listed below, or by using the keyword search tool below to find specific information within the annual report.-
 1
1 -
2
-
3
-
4
-
5
-
6
-
7
-
8
-
9
-
10
-
11
-
12
-
13
-
14
-
15
-
16
-
17
-
18
-
19
-
20
-
21
-
22
-
23
-
24
-
25
-
26
-
27
-
28
-
29
-
30
-
31
-
32
-
33
-
34
-
35
-
36
-
37
-
38
-
39
-
40
-
41
-
42
-
43
-
44
-
45
-
46
-
47
-
48
-
49
-
50
-
51
-
52
-
53
-
54
-
55
-
56
-
57
-
58
-
 59
59 -
 60
60 -
 61
61 -
 62
62 -
 63
63 -
 64
64 -
 65
65 -
 66
66 -
 67
67 -
 68
68 -
 69
69 -
 70
70 -
 71
71 -
 72
72 -
 73
73 -
 74
74 -
 75
75 -
 76
76 -
 77
77 -
 78
78 -
 79
79 -
80
-
81
-
82
-
83
-
84
-
85
-
86
-
87
-
88
-
89
-
90
-
91
-
92
-
93
-
94
-
95
-
96
-
97
-
98
-
99
-
100
-
101
-
102
-
103
-
104
-
105
-
106
-
107
-
108
-
109
-
110
-
111
-
112
 |
 |

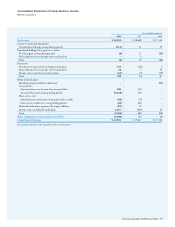
Chevron Corporation 2008 Annual Report 67
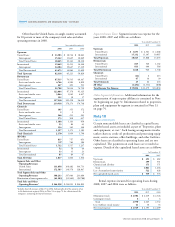
During 2008, Chevron implemented legal reorganiza-
tions in which certain Chevron subsidiaries transferred assets
to or under CUSA. The summarized financial information
for CUSA and its consolidated subsidiaries presented in the
table below gives retroactive effect to the reorganizations as if
they had occurred on January 1, 2006. However, the financial
information in the following table may not reflect the financial
position and operating results in the periods presented if the
reorganization actually had occurred on that date.
Year ended December 31
2008 2007 2006
Sales and other operating
revenues $ 195,593 $ 153,574 $ 145,774
Total costs and other deductions 185,788 147,510 137,765
Net income 7,237 5,203 5,668
At December 31
2008 2007
Current assets $ 32,760 $ 32,801
Other assets 31,806 27,400
Current liabilities 14,322 20,050
Other liabilities 14,805 11,447
Net equity 35,439 28,704
Memo: Total debt $ 6,813 $ 4,433
Note 5
Summarized Financial Data Chevron Transport Corporation Ltd.
Chevron Transport Corporation Ltd. (CTC), incorporated in
Bermuda, is an indirect, wholly owned subsidiary of Chevron
Corporation. CTC is the principal operator of Chevron’s inter-
national tanker fleet and is engaged in the marine transportation
of crude oil and refined petroleum products. Most of CTC’s
shipping revenue is derived from providing transportation serv-
ices to other Chevron companies. Chevron Corporation has
fully and unconditionally guaranteed this subsidiary’s obliga-
tions in connection with certain debt securities issued by a third
party. Summarized financial information for CTC and its con-
solidated subsidiaries is presented in the following table:
Year ended December 31
2008 2007 2006
Sales and other operating revenues $ 1,022 $ 667 $ 692
Total costs and other deductions 947 713 602
Net income 120 (39) 119
At December 31
2008 2007
Current assets $ 482 $ 335
Other assets 172 337
Current liabilities 98 107
Other liabilities 88 188
Net equity 468 377
There were no restrictions on CTC’s ability to pay divi-
dends or make loans or advances at December 31, 2008.
Note 6
Summarized Financial Data Tengizchevroil LLP.
Chevron has a 50 percent equity ownership interest in
Tengizchevroil LLP (TCO). Refer to Note 12 on page 72
for a discussion of TCO operations.
Summarized financial information for 100 percent of
TCO is presented in the table below:
Year ended December 31
2008 2007 2006
Sales and other operating revenues $ 14,329 $ 8,919 $ 7,654
Costs and other deductions 5,621 3,387 2,967
Net income 6,134 3,952 3,315
At December 31
2008 2007
Current assets $ 2,740 $ 2,784
Other assets 12,240 11,446
Current liabilities 1,867 1,534
Other liabilities 4,759 4,927
Net equity 8,354 7,769
Note 7
Financial and Derivative Instruments
Derivative Commodity Instruments Chevron is exposed to
market risks related to price volatility of crude oil, refined prod-
ucts, natural gas, natural gas liquids, liquefied natural gas and
refinery feedstocks.
The company uses derivative commodity instruments to
manage these exposures on a portion of its activity, including
firm commitments and anticipated transactions for the pur-
chase, sale and storage of crude oil, refined products, natural
gas, natural gas liquids and feedstock for company refineries.
From time to time, the company also uses derivative commod-
ity instruments for limited trading purposes.
The company uses Inter national Swaps and Derivatives
Association agreements to govern derivative contracts with cer-
tain counterparties to mitigate credit risk. Depending on the
nature of the derivative transactions, bilateral collateral arrange-
ments may also be required. When the company is engaged in
more than one outstanding derivative transaction with the same
counterparty and also has a legally enforceable netting agree-
ment with that counterparty, the net mark-to-market exposure
represents the netting of the positive and negative exposures
with that counterparty and is a reasonable measure of the
company’s credit risk exposure. The company also uses other
netting agreements with certain counterparties with which it
conducts significant transactions to mitigate credit risk.
The fair values of the outstanding contracts are reported
on the Consolidated Balance Sheet as “Accounts and notes
receivable,” “Accounts payable,” “Long-term receivables –
net” and “Deferred credits and other noncurrent obligations.”
Gains and losses on the company’s risk management activities
Note 4 Summarized Financial Data – Chevron U.S.A. Inc. – Continued