Chevron 2008 Annual Report Download - page 74
Download and view the complete annual report
Please find page 74 of the 2008 Chevron annual report below. You can navigate through the pages in the report by either clicking on the pages listed below, or by using the keyword search tool below to find specific information within the annual report.-
 1
1 -
2
-
3
-
4
-
5
-
6
-
7
-
8
-
9
-
10
-
11
-
12
-
13
-
14
-
15
-
16
-
17
-
18
-
19
-
20
-
21
-
22
-
23
-
24
-
25
-
26
-
27
-
28
-
29
-
30
-
31
-
32
-
33
-
34
-
35
-
36
-
37
-
38
-
39
-
40
-
41
-
42
-
43
-
44
-
45
-
46
-
47
-
48
-
49
-
50
-
51
-
52
-
53
-
54
-
55
-
56
-
57
-
58
-
59
-
60
-
61
-
62
-
63
-
 64
64 -
 65
65 -
 66
66 -
 67
67 -
 68
68 -
 69
69 -
 70
70 -
 71
71 -
 72
72 -
 73
73 -
 74
74 -
 75
75 -
 76
76 -
 77
77 -
 78
78 -
 79
79 -
 80
80 -
 81
81 -
 82
82 -
 83
83 -
 84
84 -
85
-
86
-
87
-
88
-
89
-
90
-
91
-
92
-
93
-
94
-
95
-
96
-
97
-
98
-
99
-
100
-
101
-
102
-
103
-
104
-
105
-
106
-
107
-
108
-
109
-
110
-
111
-
112
 |
 |

72 Chevron Corporation 2008 Annual Report
Contingent rentals are based on factors other than the
passage of time, principally sales volumes at leased service
stations. Certain leases include escalation clauses for adjusting
rentals to reflect changes in price indices, renewal options
ranging up to 25 years, and options to purchase the leased
property during or at the end of the initial or renewal lease
period for the fair market value or other specified amount at
that time.
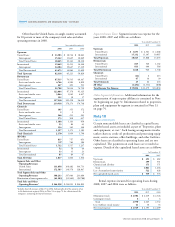
At December 31, 2008, the estimated future minimum
lease payments (net of noncancelable sublease rentals) under
operating and capital leases, which at inception had a non-
cancelable term of more than one year, were as follows:
At December 31
Operating Capital
Leases Leases
Year: 2009 $ 503 $ 97
2010 463 77
2011 372 77
2012 315 84
2013 288 59
Thereafter 947 154
Total $ 2,888 $ 548
Less: Amounts representing interest
and executory costs (110)
Net present values 438
Less: Capital lease obligations
included in short-term debt (97)
Long-term capital lease obligations $ 341
Note 11
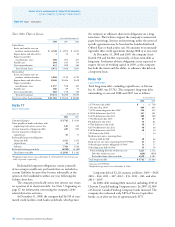
Restructuring and Reorganization Costs
In 2007, the company implemented a restructuring and
reorganization program in its downstream operations.
Approximately 900 employees were eligible for severance
payments. As of December 31, 2008, approximately 700
employees have been terminated under the program. Most of
the associated positions are located outside the United States.
The program is expected to be completed by the end of 2009.
Shown in the table below is the activity for the com-
pany’s liability related to the downstream reorganization.
The associated charges against income were categorized as
“Operating expenses” or “Selling, general and administrative
expenses” on the Consolidated Statement of Income.
Amounts before tax 2008 2007
Balance at January 1 $ 85 $ –
Accruals/adjustments (11) 85
Payments (52) –
Balance at December 31 $ 22 $ 85
Note 10 Lease Commitments – Continued
Note 12
Investments and Advances
Equity in earnings, together with investments in and advances
to companies accounted for using the equity method and other
investments accounted for at or below cost, is shown in the
table below. For certain equity affiliates, Chevron pays its share
of some income taxes directly. For such affiliates, the equity in
earnings does not include these taxes, which are reported on the
Consolidated Statement of Income as “Income tax expense.”
Investments and Advances Equity in Earnings
At December 31 Year ended December 31
2008 2007 2008 2007 2006
Upstream
Tengizchevroil $ 6,290 $ 6,321 $ 3,220 $ 2,135 $ 1,817
Petropiar/Hamaca 1,130 1,168 317 327 319
Petroboscan 816 762 244 185 31
Angola LNG Limited 1,191 574 (8) 21 –
Other 725 765 206 204 123
Total Upstream 10,152 9,590 3,979 2,872 2,290
Downstream
GS Caltex Corporation 2,601 2,276 444 217 316
Caspian Pipeline Consortium 749 951 103 102 117
Star Petroleum Refining
Company Ltd. 877 944 22 157 116
Escravos Gas-to-Liquids – 628 86 103 146
Caltex Australia Ltd. 723 580 250 129 186
Colonial Pipeline Company 536 546 32 39 34
Other 1,664 1,501 268 215 212
Total Downstream 7,150 7,426 1,205 962 1,127
Chemicals
Chevron Phillips Chemical
Company LLC 2,037 2,024 158 380 697
Other 25 24 4 6 5
Total Chemicals 2,062 2,048 162 386 702
All Other
Other 567 449 20 (76) 136
Total equity method $ 19,931 $ 19,513 $ 5,366 $ 4,144 $ 4,255
Other at or below cost 989 964
Total investments and
advances $ 20,920 $ 20,477
Total United States $ 4,002 $ 3,889 $ 307 $ 478 $ 955
Total International $ 16,918 $ 16,588 $ 5,059 $ 3,666 $ 3,300
Descriptions of major affiliates, including significant
differences between the company’s carrying value of its
investments and its underlying equity in the net assets of
the affiliates, are as follows:
Tengizchevroil Chevron has a 50 percent equity ownership
interest in Tengizchevroil (TCO), a joint venture formed in
1993 to develop the Tengiz and Korolev crude oil fields in
Kazakhstan over a 40-year period. At December 31, 2008,
the company’s carrying value of its investment in TCO was
about $210 higher than the amount of underlying equity in
TCO net assets. This difference results from Chevron acquir-
ing a portion of its interest in TCO at a value greater than the
underlying equity for that portion of TCO’s assets.
Notes to the Consolidated Financial Statements
Millions of dollars, except per-share amounts